
Introduction to STAT 100 and the Toolkit
Hello R, Quarto, and Git/GitHub
Mine Doğucu
Welcome to STATS 100
- Introduction to People
- Introduction to the Course
- Introduction to the Toolkit
Introduction to People
Hello 👋
Mine Dogucu
pronounciation: Mi-neh Doe-uu-joo
Senior Lecturer on Statistics
I joined Harvard in July.
My First Home
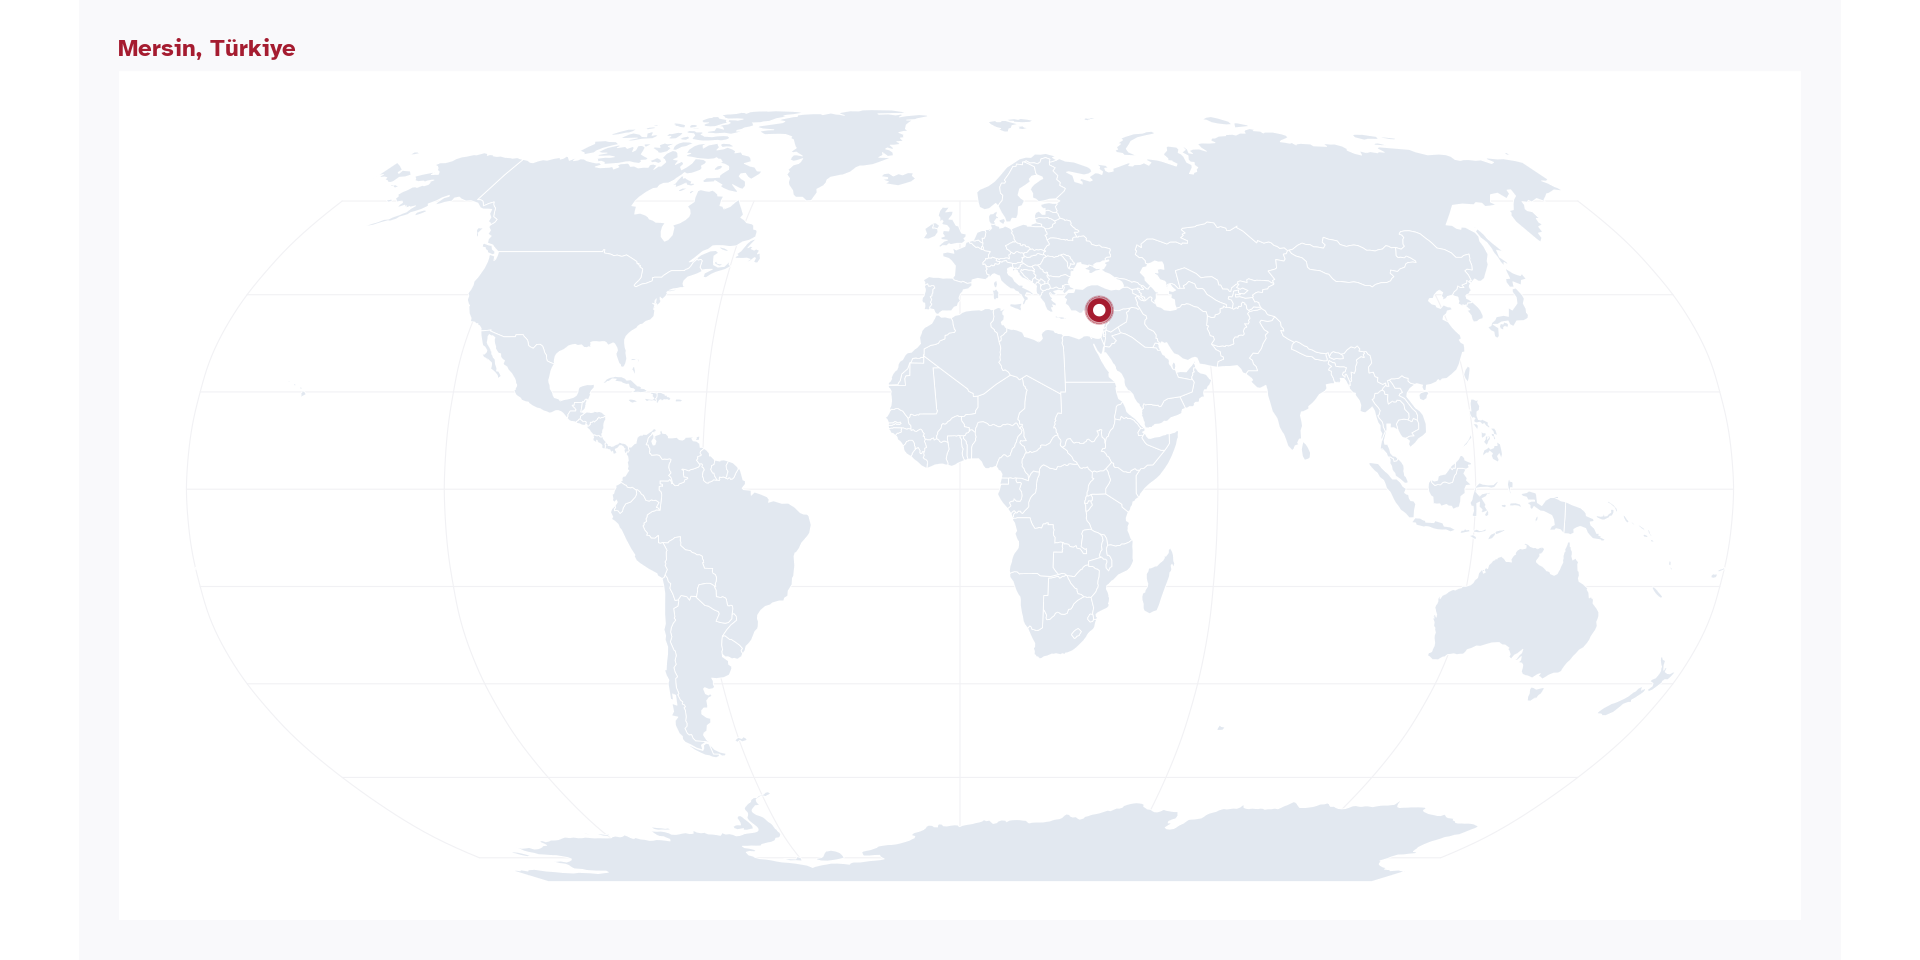
Fun fact: My native language (Turkish) does not have gendered pronouns. In English, I use she/they as my pronouns.
Most Recent Home

I was Associate Professor of Teaching in the Department of Statistics at University of California Irvine.
Fun facts about me
- I have two cats: Mohsen (left) and Mojdeh (right).
- I lived in the 20th century.
- I love languages (and linguistics), movies, and books.
- Not so fun fact: I was a first generation, low income college student.
Meet the Teaching Team
THANKFULLY, I am NOT teaching this class by myself.
Meet your preceptor, Julie.
Meet the rest of the Teaching Team on the course website.
Meet Your Peers
Discussion In groups of three or four meet and greet each other. You may consider sharing some or all of the following:
- Your name
- Your pronouns
- Your year
- Where you live
- What excites you about this semester
Meet Your Peers - Location
Help from the Teaching Team
- We are here to help you throughout the semester on your BEST days and WORST days when it comes to STAT 100.
- Make sure to use the calendar feature on the Home page to find office hours.
Concerns - Math
Some good news:
Statistics is not math but it does use math - like physics.
We do not have problem sets - we have homework assignments. 😊
Other Concerns
- No programming background - That’s OK. Programming is not a prerequisite
- Time management - ARC has great tips and accountability hours.
- I might need help - Great, we are here to help you! Office Hours.
Introduction to the Course
Learning Effort
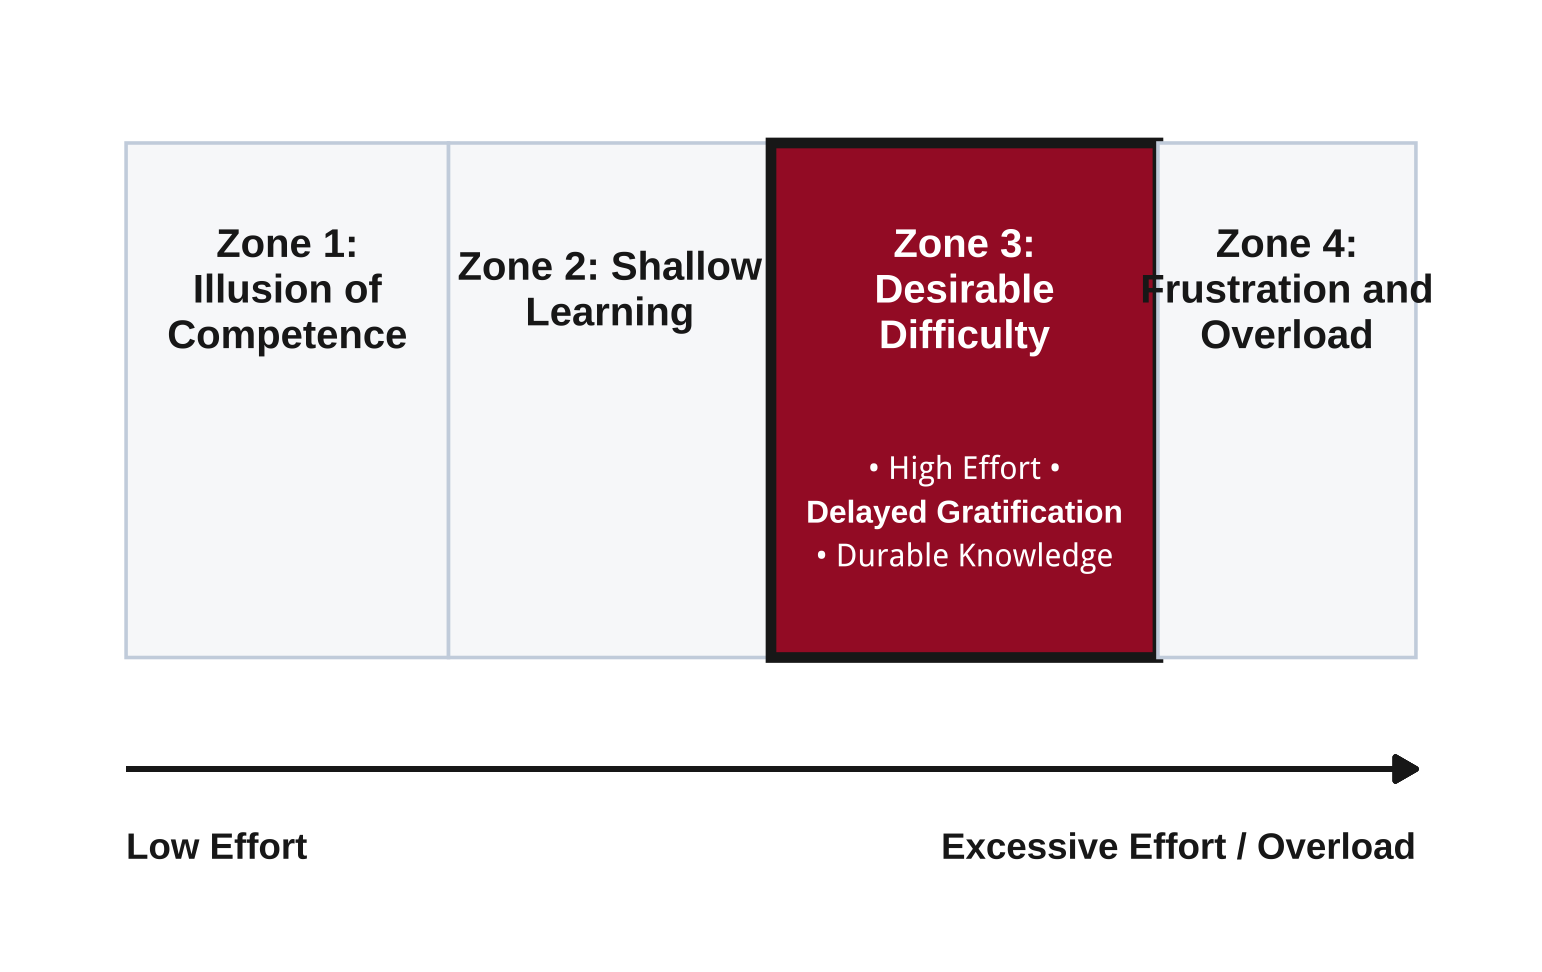
A brief history lesson
People have been playing chance games for a long time. These tools from Ice Age from 12,800-12,200 years ago are said to be dice used by Native Americans of the Great Plains region.
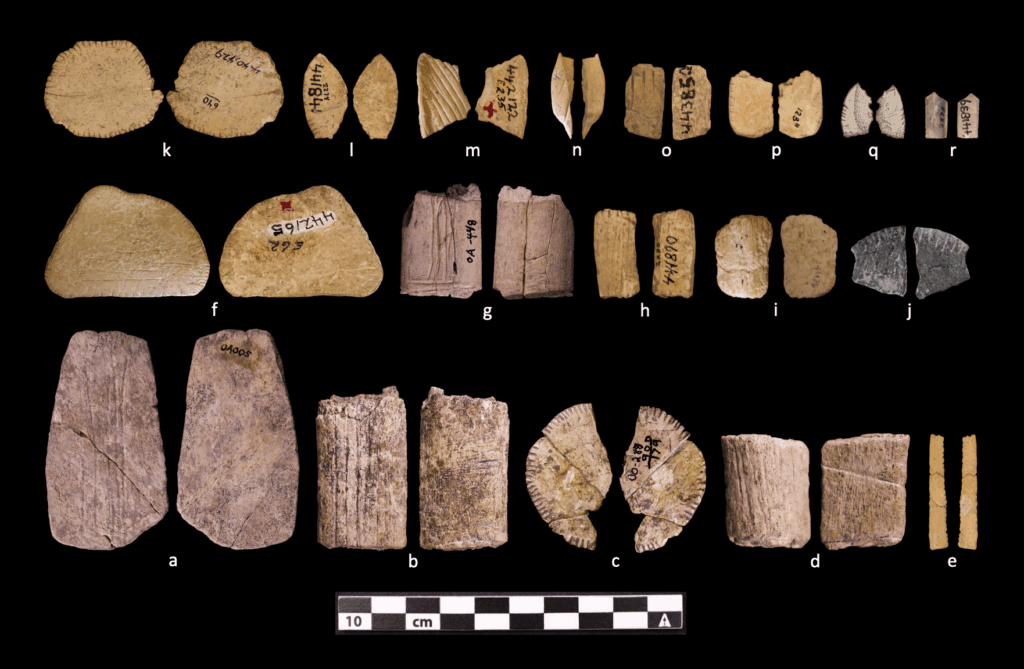
Image from Colorado State University, College of Liberal Arts
People played chance games but they “probably” did not yet ask “What are the odds?”
Then came probability theory
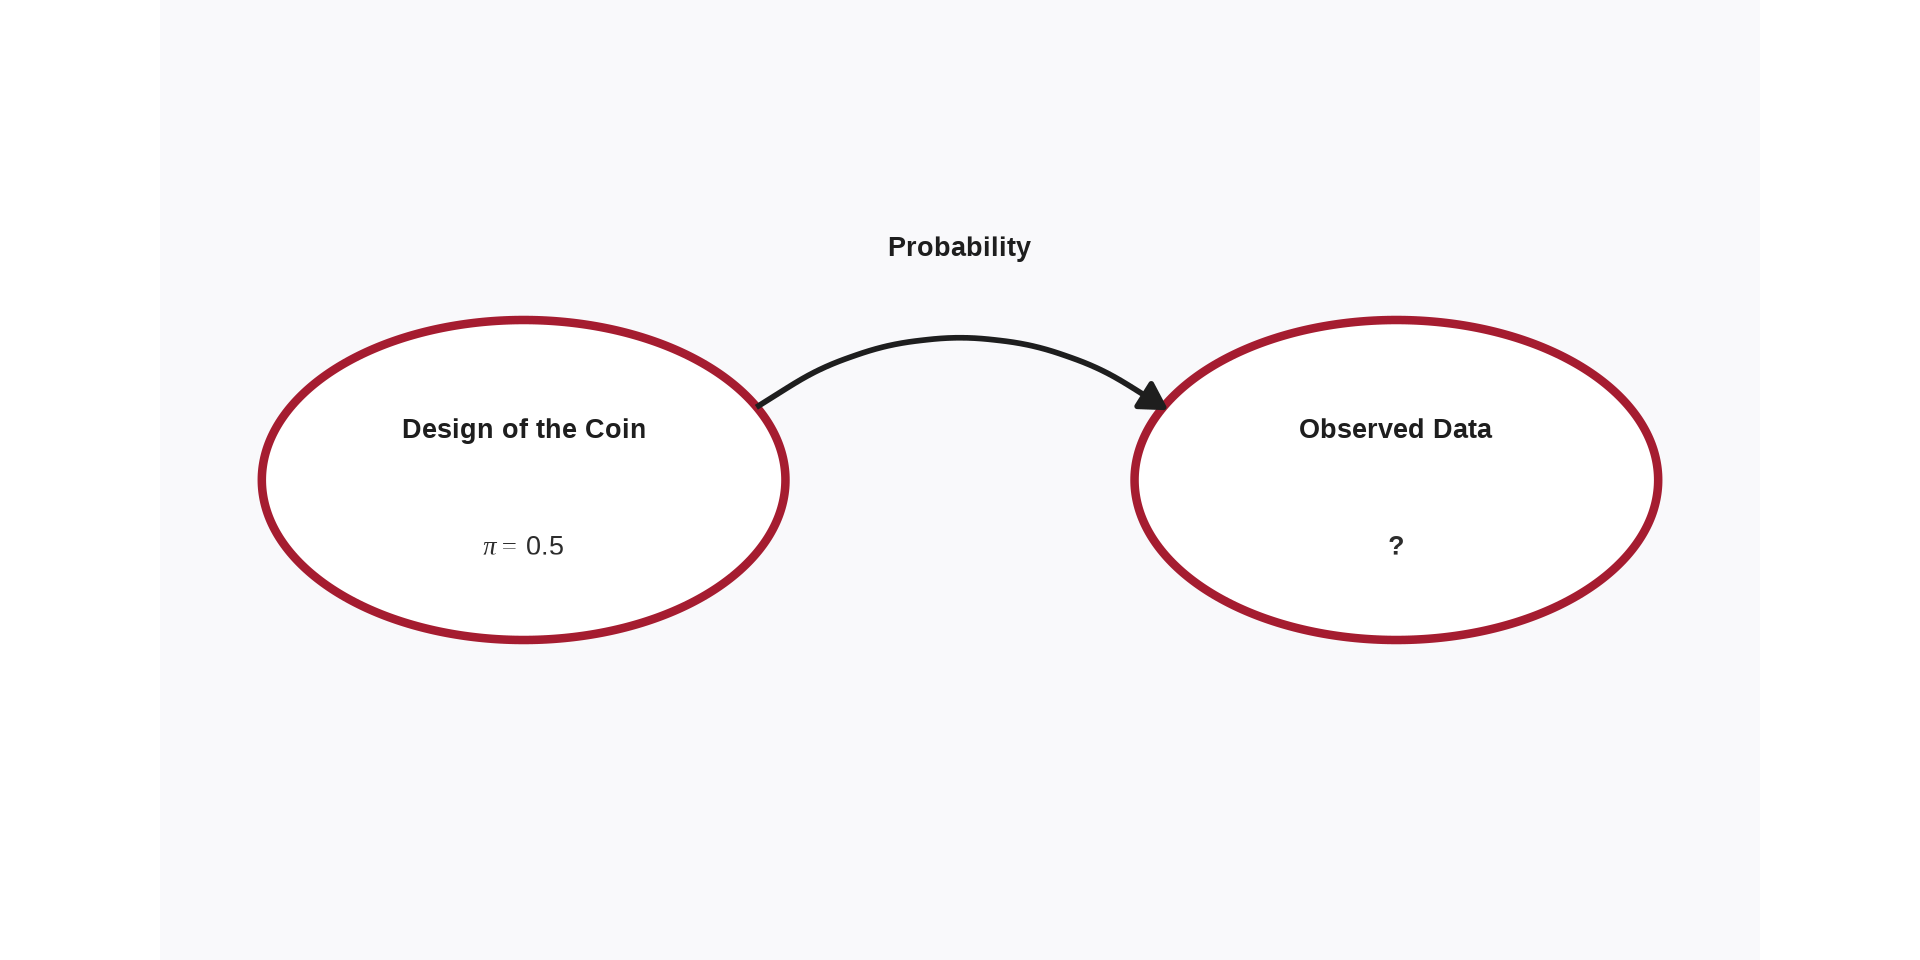
A fair coin is designed to land on heads half the time.
If I flip a coin 5 times what is the probability of getting 2 heads?
Then came statistical inference
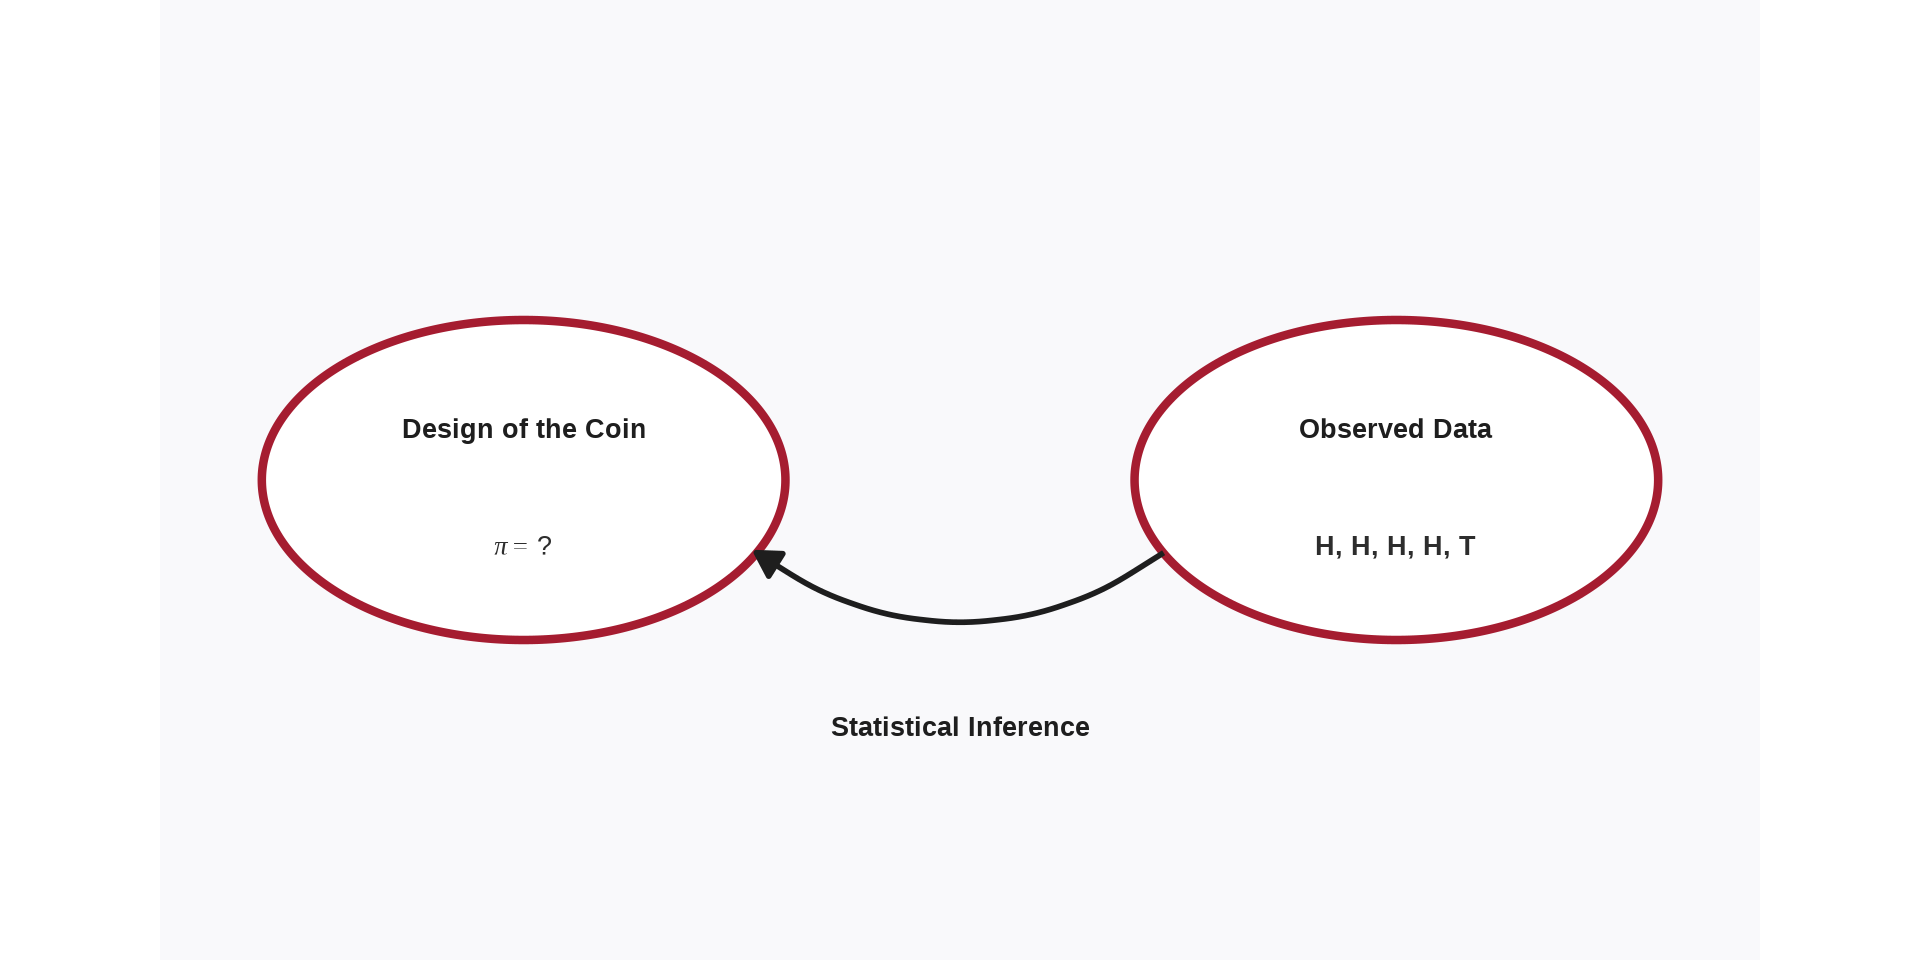
In many instances, we do not know the design of the coin and we are wondering if it is a fair coin. For instance if we observe H, H, H, H, T on five coin flips, what is the likelihood that this is a fair coin?
More questions
These days statisticians and scientists who use statistics ask more interesting questions than just gambling!
How do companies benefit when employees work remotely?
Can social isolation, loneliness shorten life?
Who wrote the Beatles song “In My Life?” John Lennon or Paul McCartney?
Then came data science
Modern times brought
- big data, high dimensional data (dataset with lots of information)
- different types of data (e.g., text and images at larger scale and precision)
- a lot of user data
- computational advances
- complex algorithms
Even more questions
How does Netflix predict which thumbnail image will make you click a movie?
The 4 Workflow Phases We’ll Learn
- Preparation
- Defining the problem
- Formulating research questions
- Data acquisition
- Data cleaning
- Analysis
- Descriptive statistics
- Data Visualization
- Statistical Modeling
- Interpretation
- Model evaluation
- Inference
- Dissemination
- Communicating findings
- Writing reports online
- Writing papers
Example Study
Read the abstract of the following study and decide with your neighbors what kind of data had to be collected about students to make the claims that the researchers are making.
Some types of questions that can be answered using statistics
Descriptive
Comparative
Relational
Predictive
Some findings from the manuscript - Descriptive
…at the time of our survey (June 2025), around 80 percent of the students report using generative AI. The most popular tools were Doubao, DeepSeek, ChatGLM, Ernie Bot, and Qwen. Generative AI was reported to be most frequently used in mathematics (66 percent) and English (55 percent), while between 30 and 40 percent of the students report AI use in other subjects.
Some findings from the manuscript - Comparative
Students who used generative AI for homework completed assignments 30% faster.
Some findings from the manuscript - Relational
For AI-using students, the pattern is quite different. More than half of AI students spend 20-50 minutes completing homework, less time than even the fastest non-AI students. This group receives very high homework scores. Their median score is consistent with the performance of generative AI tools on similar problems (Hou et al., 2024). At the same time, they receive extremely low exam scores. This pattern- low time on task, high homework scores, and low exam scores- is entirely consistent with homework outsourcing.
Some findings from the manuscript - Predictive
In traditional educational settings, homework performance reliably predicts exam performance, reflecting the practice and consolidation effects of completing learning tasks. Figure A11 illustrates this relationship for non-AI students.
Mini Syllabus
- AI policy
- No-tech policy (except for quiz time)
- In class quizzes
- Homework assignments
- Section activities
- Exams
- Project
Classroom Vibes
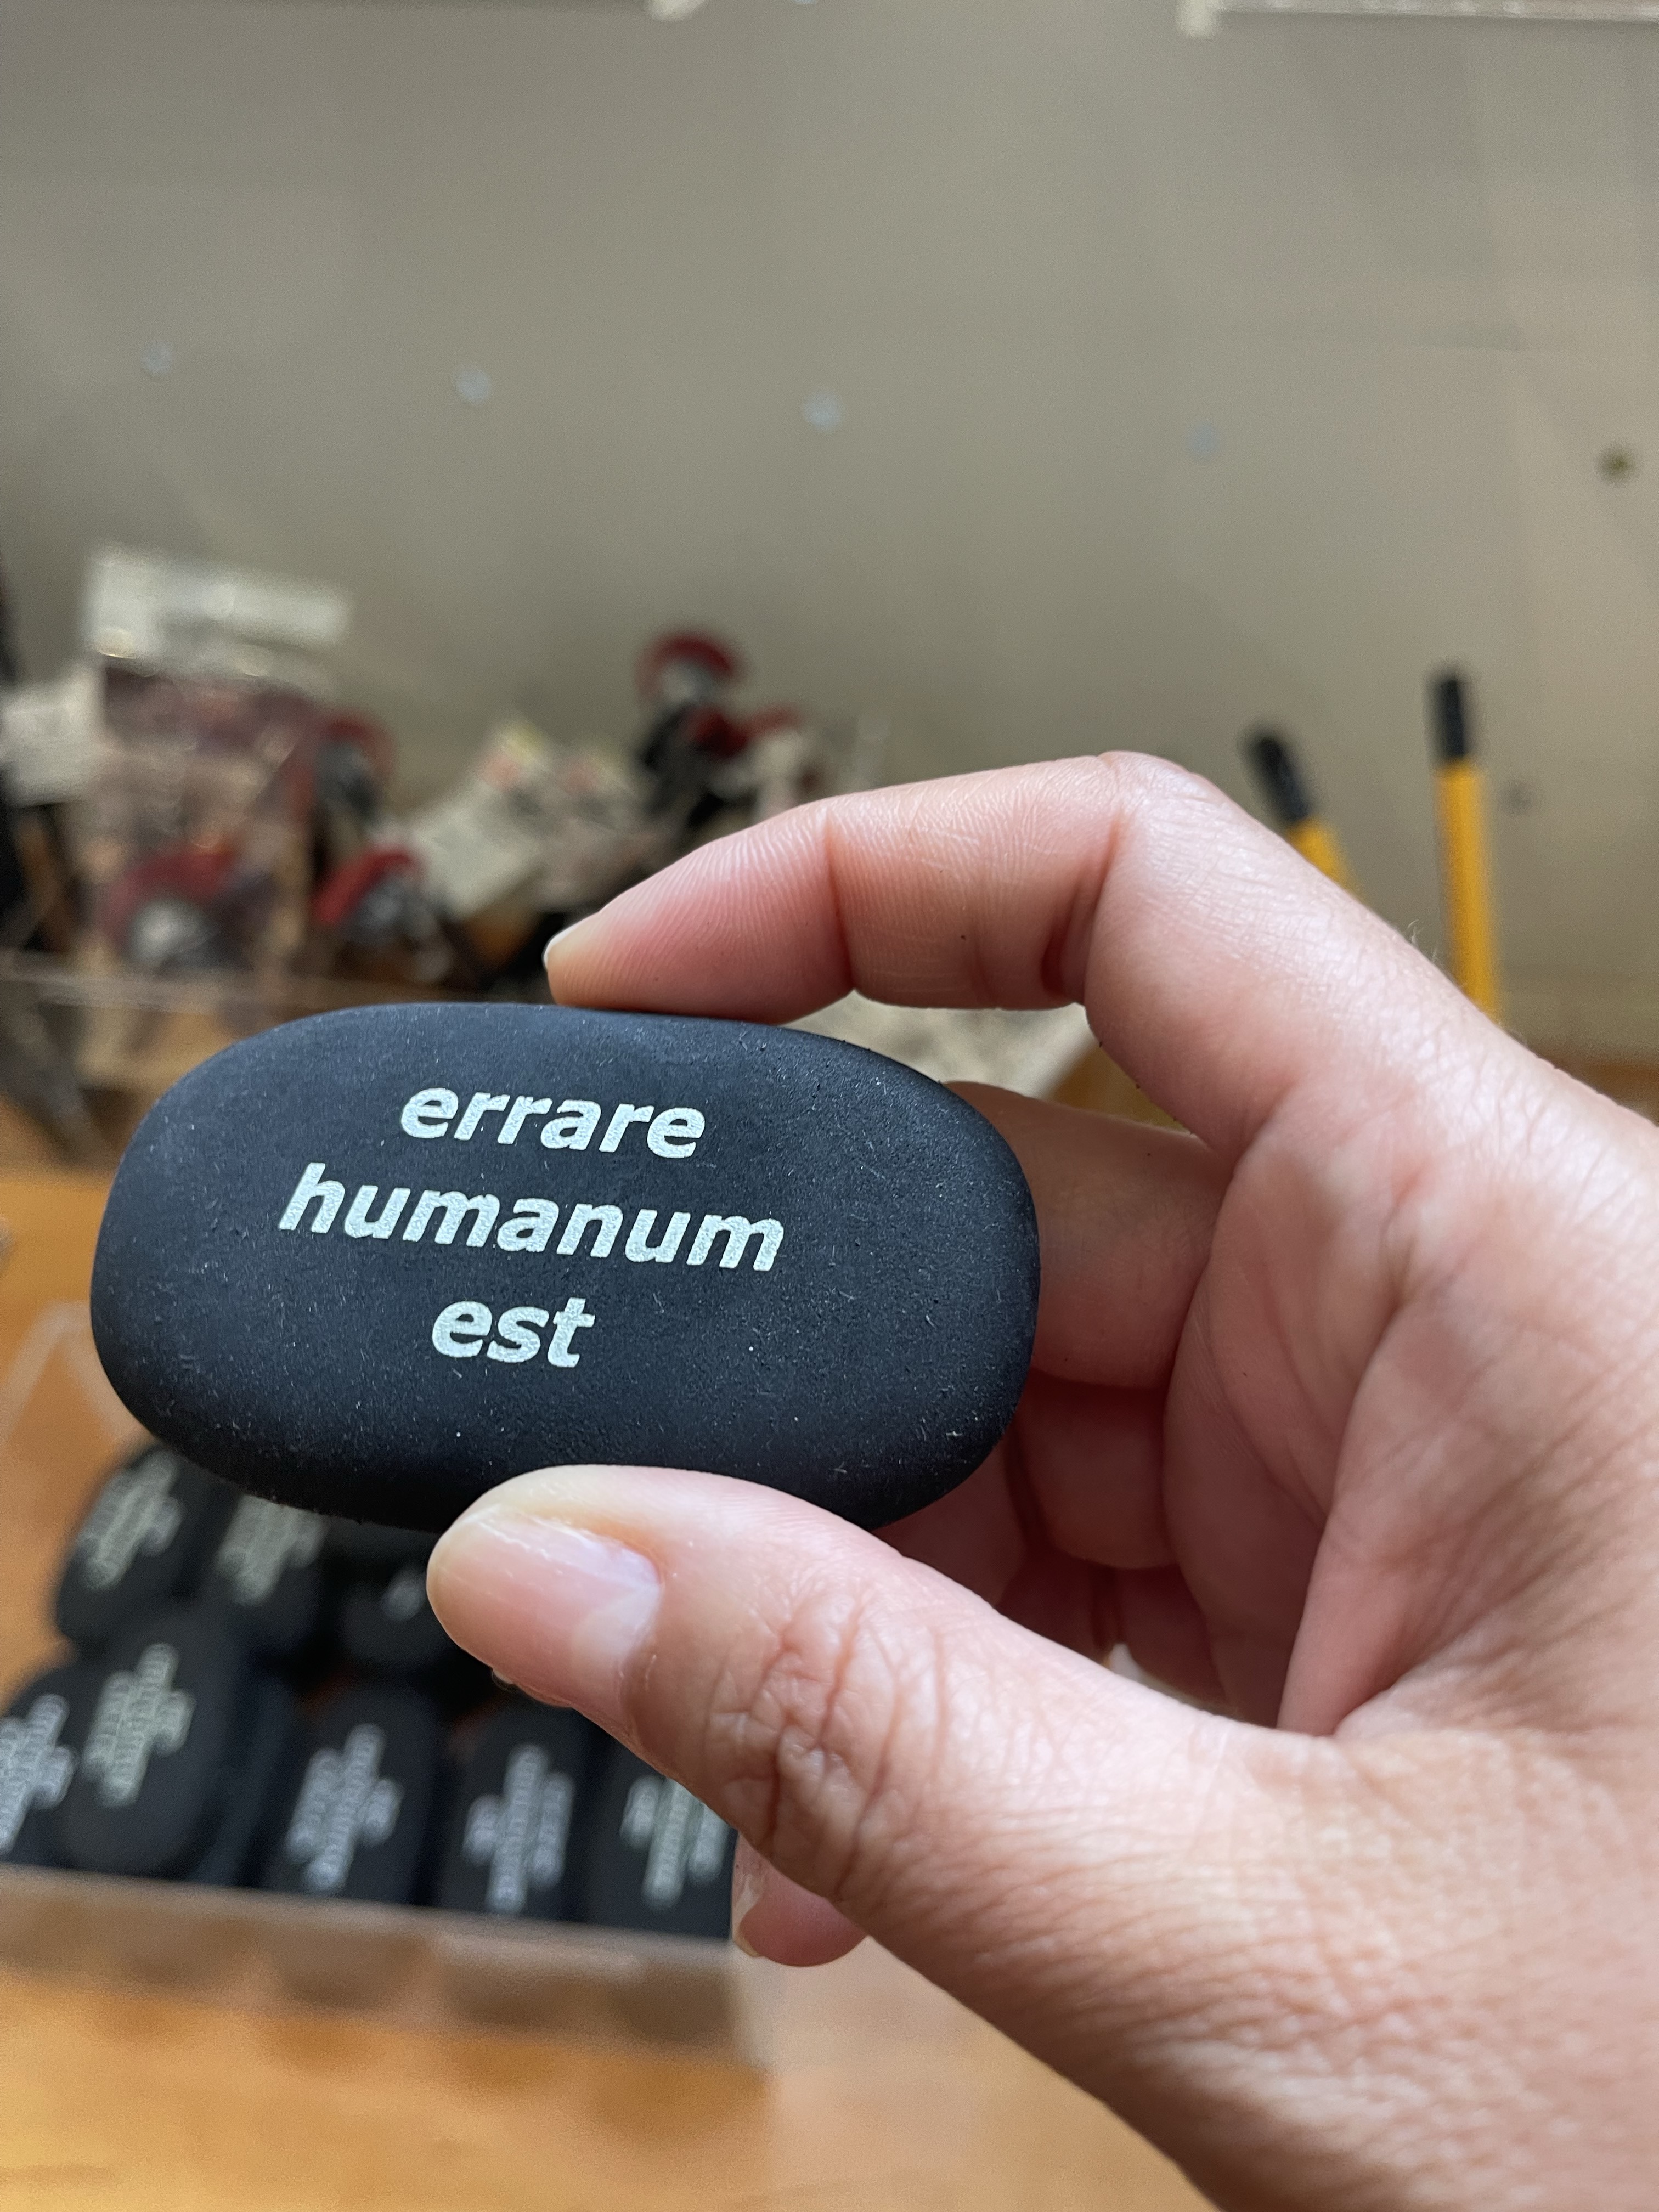
Mistakes are part of the learning process. “Good mistakes” help you learn.
There are no stupid questions.
Be kind to yourself and to others.
Maintain complete honesty and transparency in every form of communication (e.g., daily conversations with me and teammates, formal data reporting in assignments).
Slides - how to pdf
If you would like to print or save pdf version of the slides then press M in your web browser Click Tools > PDF Export Mode.
Introduction to the Toolkit
hello woRld
I will demo live in class but a video is provided to you to review after class. Our lecture hall does not have recording software. 😭
Code from demo
Code from demo
Object assignment operator
Keyboard Shortcut
Windows: Alt + -
Mac: Option + -
R is case-sensitive
Characters
If something comes in quotes, it is not defined in R. Later in the quarter we will call these as characters. More on that later.
Vocabulary
do() is a function;
something is the argument of the function.
Getting Help
In order to get any help we can use ? followed by function (or object) name.
Do not copy paste
You should not copy paste code from my slides or from the internet. Part of learning to code is building up your muscle memory.
tidyverse style guide
canyoureadthissentence?
tidyverse style guide
After function names do not leave any spaces.
Before and after operators (e.g. <-, =) leave spaces.
Put a space after a comma, not before.
Object names are all lower case, with words separated by an underscore.
Indentation
You can let RStudio do the indentation for your code.
Literate Programming - Quarto
I will demo live in class but a video is provided to you to review after class.
The file I create in the video similar to the my-first-report.qmd file provided here.
markdown
markdown is a markup language. Markup languages instruct software on how to display or interpret text and data. We use markdown within a Quarto document.
_Hello world_

__Hello world__

~~Hello world~~
Hello world
Hello world
Hello world
Quarto parts
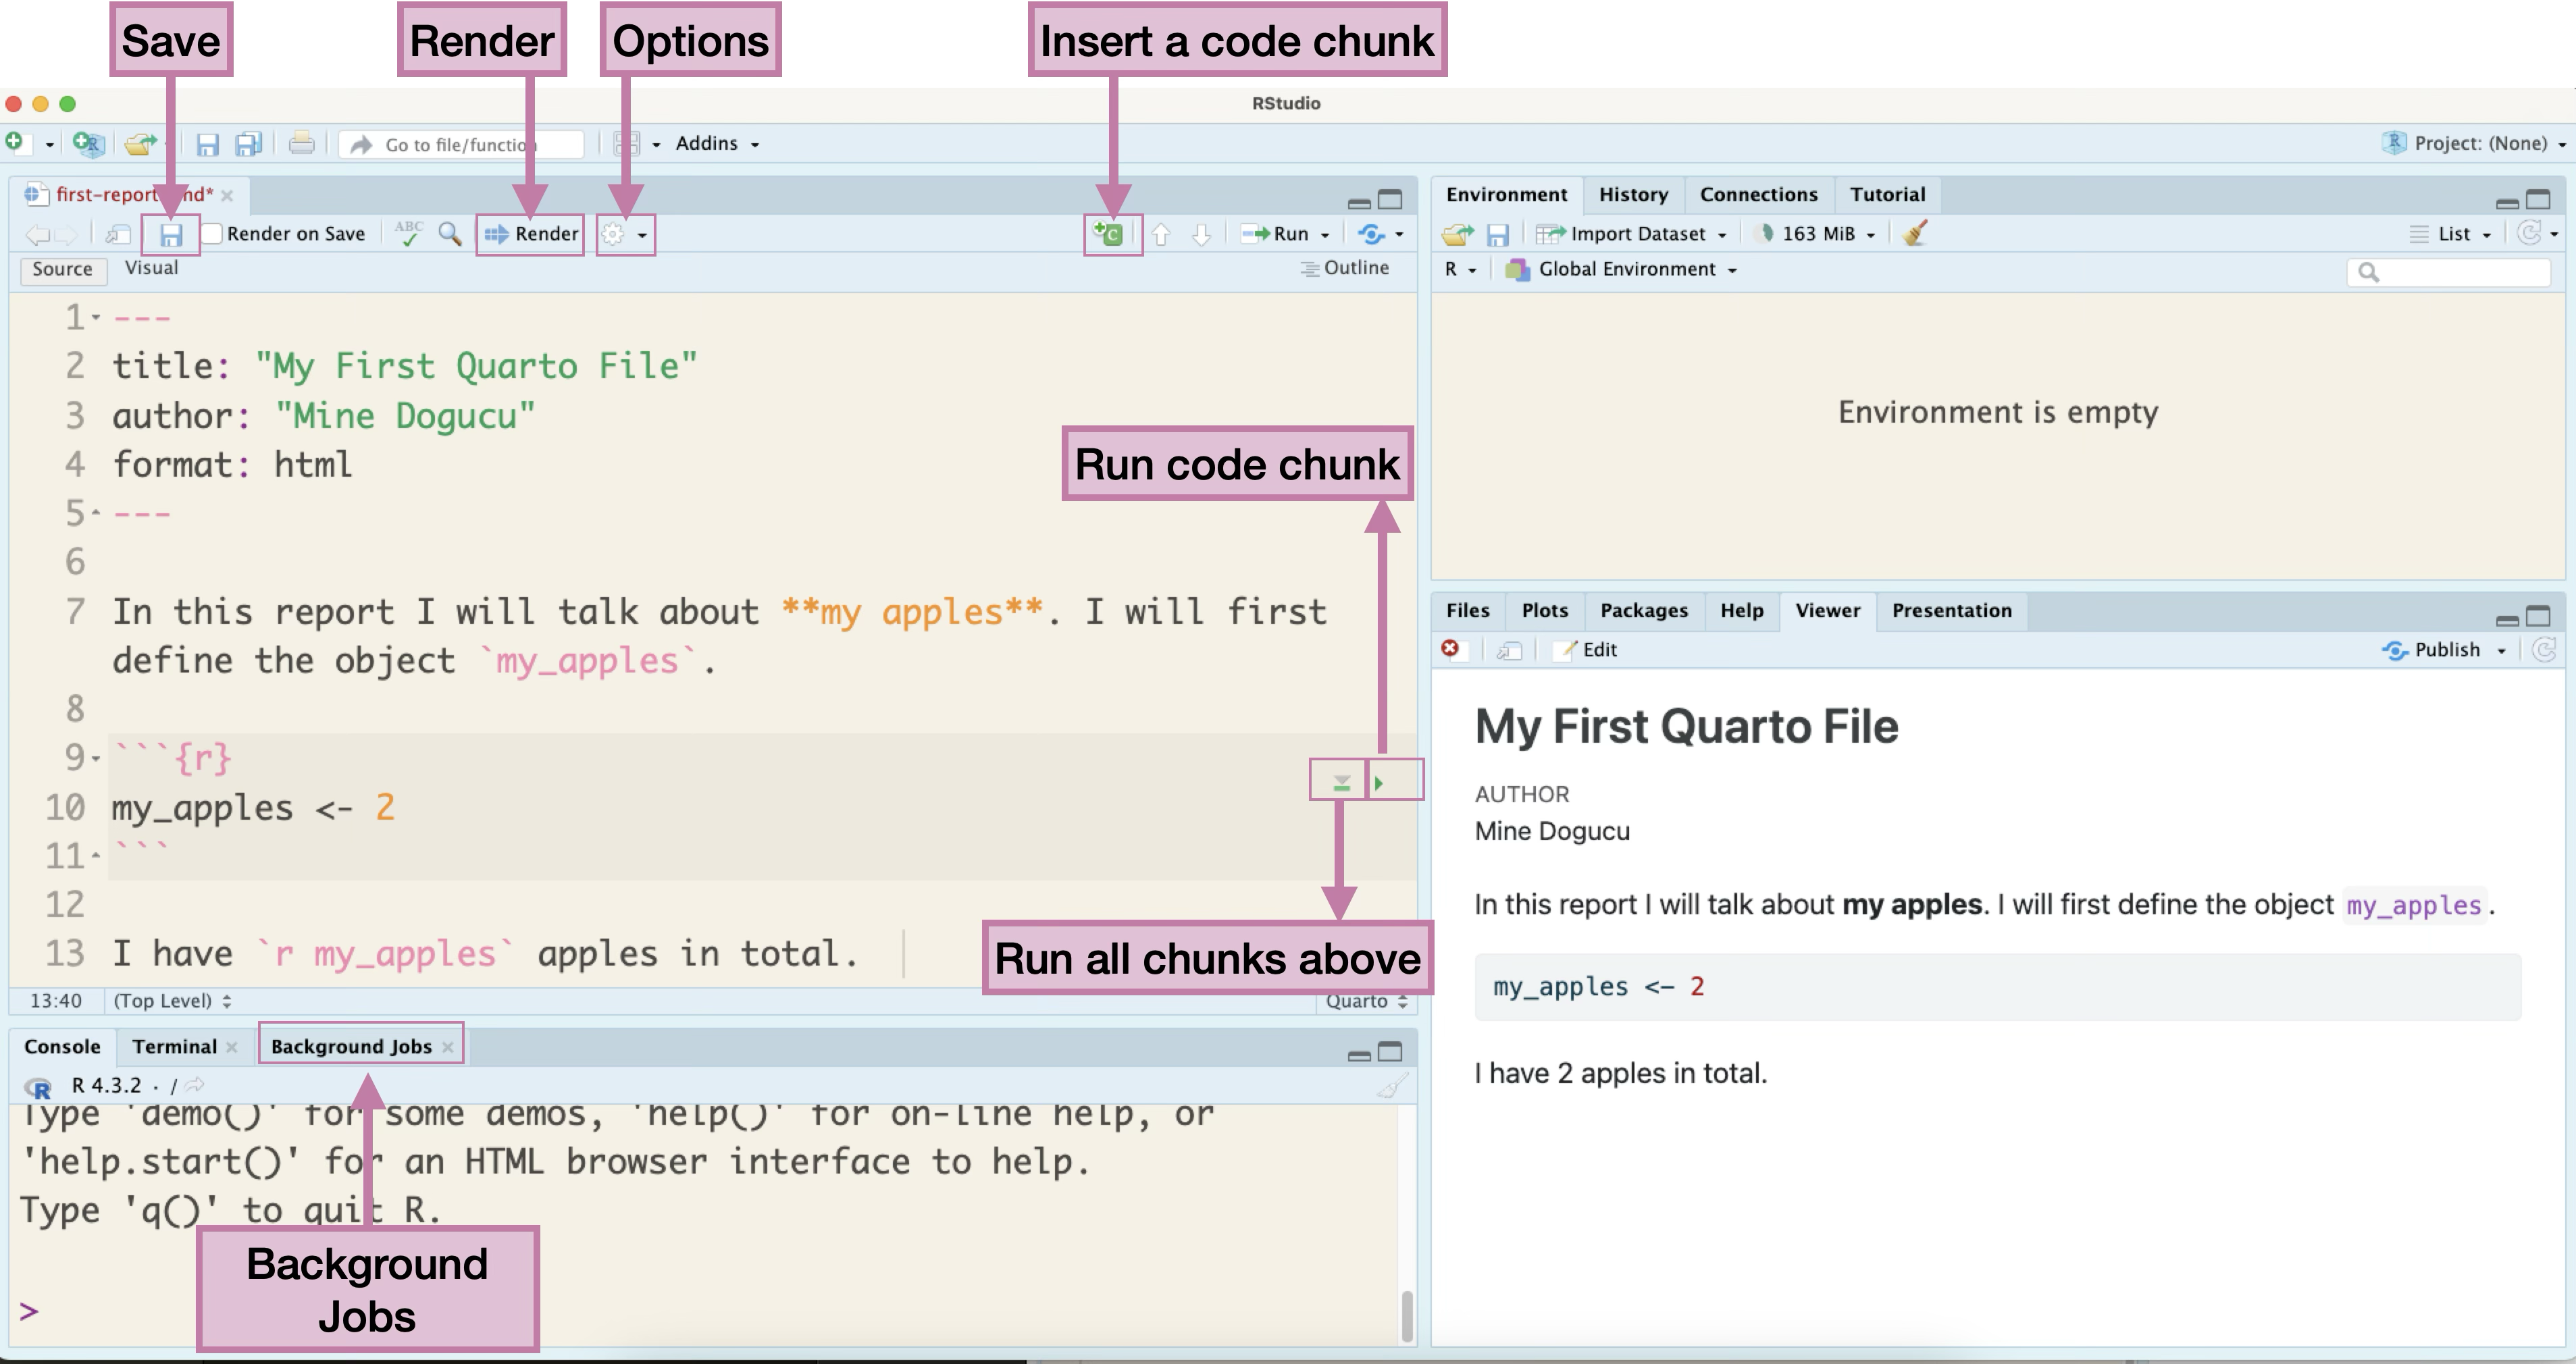
Quarto source file can be accessed here my-first-report.qmd.
Slides for this course
Slides that you are currently looking at are also written in Quarto. You can take a look at them on our course’s GitHub organization in the slides repo.
Phone apps vs. R packages
When you buy a new phone it comes with some apps pre-installed.
- Calendar
- Messages
If you want to use a different app you can install it.
- GMail
- BlueSky
When you download R for the first time to your computer. It comes with some packages already installed. You can also install many other R packages.
R packages
What do R packages have? All sorts of things but mainly
functions
datasets
R packages
Try running the following code:
Why are we seeing this error?
Installing packages
In your Console, install the beepr package
We do this in the Console because we only need to do it once. If we add this code in Quarto, we will be installing the package again and again each time we render the document.
Using beep() from beepr
Option 1
More common usage.
Useful if you are going to use multiple functions from the same package. E.g. we have used many functions (ggplot, aes, geom_…) from the ggplot2 package. In such cases, usual practice is to put the library name in the first R chunk in the .qmd file.
Using beep() from beepr
Option 2
Useful when you are going to use a function once or few times. Also useful if there are any conflicts. For instance if there is some other package in your environment that has a beep() function that prints the word beep, you would want to distinguish the beep function from the beepr package and the beep function from the other imaginary package.
Reading the documentation
Running ?beep in the Console opens the Help pane with the package documentation. We run this in the Console and not in Quarto so that we won’t get the help every time we render the Quarto document.
beep {beepr} - indicates that the beep package is in the beepr package
Pay attention to parts of documentation: Description, Usage, Arguments, Details, Examples. At your stage Examples are a great resource.
Reading the documentation
beep(sound = 1, expr = NULL) indicates that the default sound is set to be 1.
Pay attention to argument options.
Usage example
This should play the mariokart sound.
Open Source
Any one around the world can create R packages.
Good part: We are able to do pretty much anything R because someone from around the world has developed the package and shared it.
Bad part: The language can be inconsistent.
Good news: We have tidyverse.
Tidyverse
The tidyverse is an opinionated collection of R packages designed for data science. All packages share an underlying design philosophy, grammar, and data structures. tidyverse.org
Tidyverse
In short, tidyverse is a family of packages. From practical stand point, you can install many tidyverse packages at once (and you did this).
Load tidyverse packages
We can also load multiple tidyverse packages all at the same time.
── Attaching core tidyverse packages ──────────────────────── tidyverse 2.0.0 ──
✔ forcats   1.0.1     ✔ readr     2.2.0
✔ lubridate 1.9.5     ✔ tibble    3.3.1
✔ purrr     1.2.2     ✔ tidyr     1.3.2
── Conflicts ────────────────────────────────────────── tidyverse_conflicts() ──
✖ dplyr::filter() masks stats::filter()
✖ dplyr::lag()    masks stats::lag()
ℹ Use the conflicted package (<http://conflicted.r-lib.org/>) to force all conflicts to become errors
Bad version control
Does this look familiar?
hw1
hw1_final
hw1_final2
hw1_final3
hw1_finalwithfinalimages
hw1_finalestfinal
Good version control
What if we tracked our file with better names for each version and have only 1 file hw1?
hw1 added questions 1 through 5
hw1 changed question 1 image
hw1 fixed typos
We will call the descriptions in italic commit messages.
git vs. GitHub
git allows us to keep track of different versions of a file(s).
GitHub is a website where we can store (and share) different versions of the files.
GitHub repo
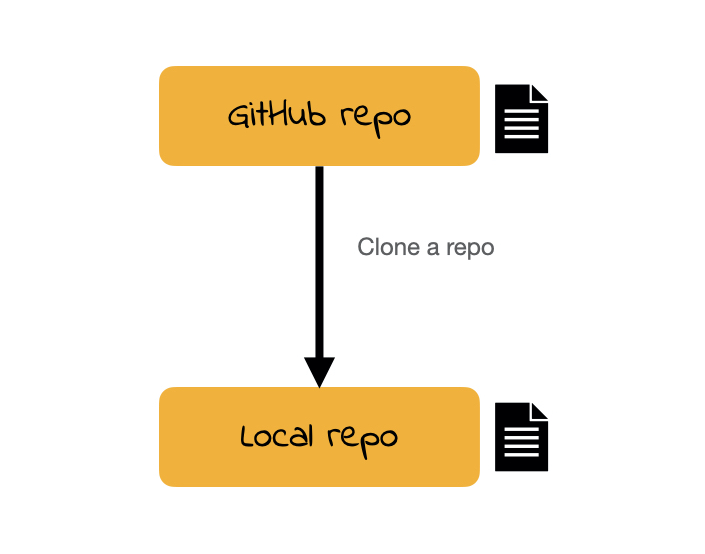
Cloning a repo
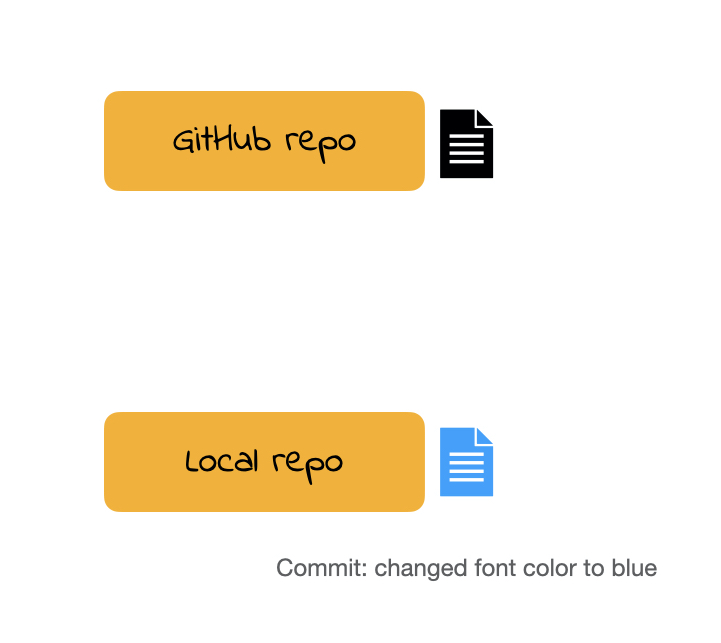
Commiting a change 1
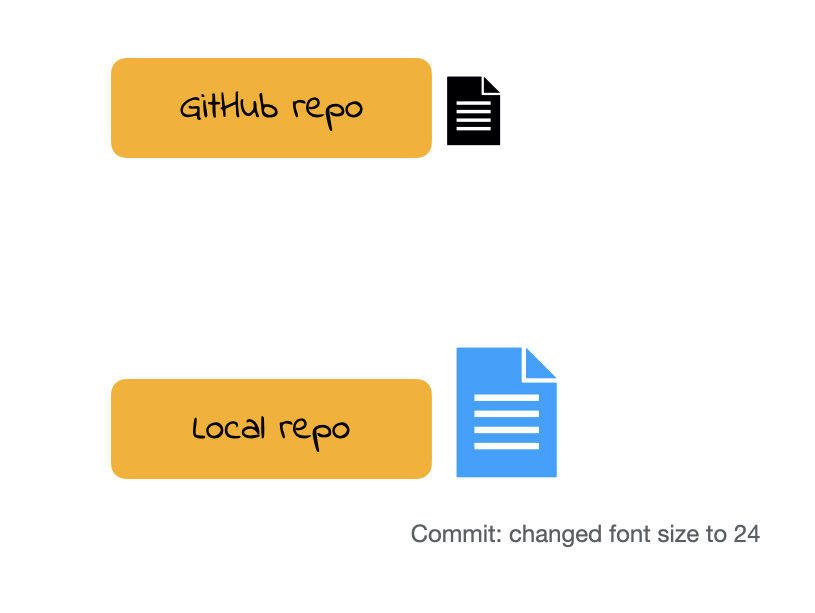
Commiting a change 2
Commiting a change 3
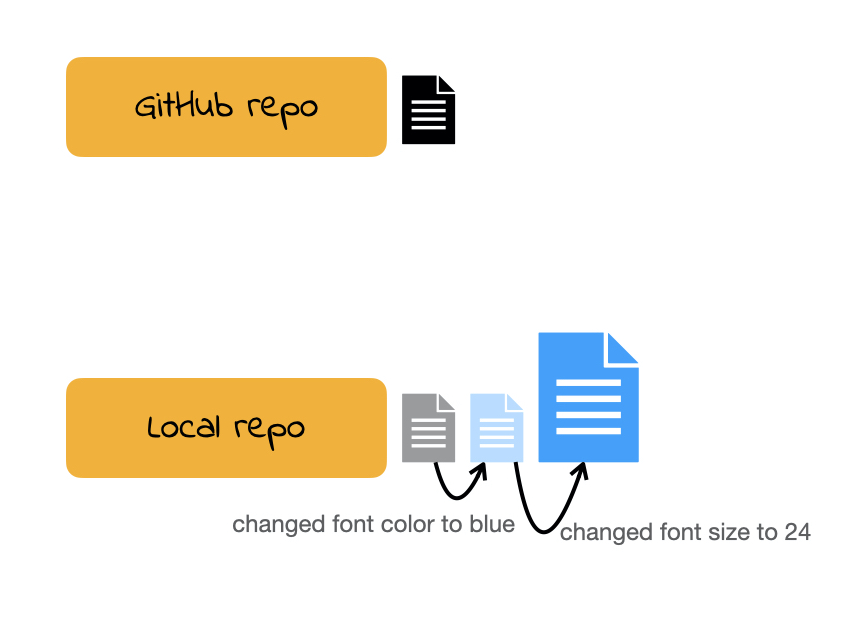
Push
Git and GitHub demo
I will demo live in class but this video is provided to you to review after class.
R Project files
Always use .Rproj file to open projects. Then open the appropriate .qmd / .R file from the Files pane. If you don’t open .Rproj file you will not be able to see the Git pane.
Cloning a repo
A repo is a short form of repository. Repositories contain all of your project’s files as well as each file’s revision history.
For this course our weekly repos (lecture code, activity etc.) are hosted on Github.
To clone a GitHub repo to our computer, we first copy the cloning link as shown in screencast then start an RStudio project using that link.
Cloning a repo pulls (downloads) all the elements of a repo available at that specific time.
Commits
Once you make changes to your repo (e.g. take notes after lecture, answer an activity question) you can take a snapshot of your changes with a commit.
This way if you ever have to go back in version history you have your older commits to get back to.
This is especially useful, for instance, if you want to go back to an earlier solution you have committed.
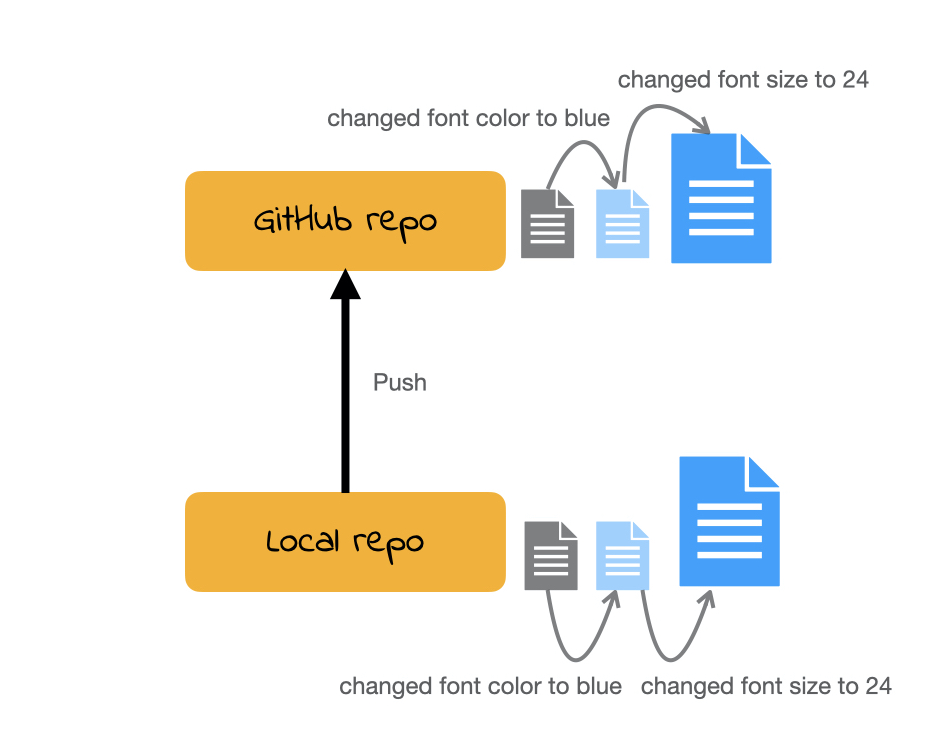
Push
All the commits you make will initially be local (i.e. on your own computer).
In order for us to see your commits and your final submission on any file, you have to push your commits. In other words upload your files at the stage in that specific time.
(An incomplete) Git/GitHub glossary
Git: is software for tracking changes in any set of files
GitHub: is an internet host for Git projects.
repo: is a short form of repository. Repositories contain all of your project’s files as well as each file’s revision history.
clone: Cloning a repo pulls (downloads) all the elements of a repo available at that specific time.
commit: A snapshot of your repo at a specific point in time. We distinguish each commit with a commit message.
push: Uploads the latest “committed” state of your repo to GitHub.
Reminders
- Make sure that you are registered for a section.
- No in-person sections this week. Everything is online. Find the videos under Schedule on the course website.
- Plenty of office hours to submit your section activity before 1:30 pm on Friday.
- Homework 1 due Monday at 1:25 pm on GitHub.
- If you have not completed the three onboarding quizzes, complete them by 5 pm today on Gradescope.
- If you are not part of GitHub organization, you cannot complete section activity. Make sure to accept the invitation sent to your email.
