- 1
- We will use the stringr package for handling strings.
- 2
- We will use the lubridate package for handling dates.
- 3
- We will use the forcats package for handling factors. You can think of forcats as for cat egorical variable s or as an anagram of factors.
Dealing with Specific Types of Variables
Strings, Dates, and Factors
Mine Doğucu
Announcements
- Midterm will be held on Oct 7 at 1:30 - 2:45 pm at Yenching Auditorium 2 Divinity Ave. Here is a walking guide from Johnny.
- “Quiz” for team preference is on Gradescope. Please complete by Wednesday 1:30 pm.
- Please complete mid-semester feedback. It will be sent to you on Wednesday.
- Come learn about the Stats programs!!! Exploring Fields of Study Event (Concentration and Secondary). Friday Oct 2, 11:30 am - 1:00 pm, Maxwell-Dworking L1.
Packages
Packages
All these packages are part of tidyverse
── Attaching core tidyverse packages ──────────────────────── tidyverse 2.0.0 ──
✔ dplyr   1.2.1     ✔ readr   2.2.0
✔ ggplot2 4.0.3     ✔ tibble  3.3.1
✔ purrr   1.2.2     ✔ tidyr   1.3.2
── Conflicts ────────────────────────────────────────── tidyverse_conflicts() ──
✖ dplyr::filter() masks stats::filter()
✖ dplyr::lag()    masks stats::lag()
ℹ Use the conflicted package (<http://conflicted.r-lib.org/>) to force all conflicts to become errors
Packages
We will also use
All this time we have been downloading packages from CRAN (Comprehensive R Archive Network). Packages on CRAN have to meet certain criteria, including size. Hence package authors who don’t meet this criteria host their packages elsewhere (e.g., GitHub).
GitHub repo for a package on CRAN - bayesrules
GitHub repo for a package not on CRAN - sfemergency25
Data
Rows: 369,089
Columns: 28
$ call_number                    <chr> "250160183", "250672403", "250120282", …
$ unit_id                        <chr> "T01", "B04", "E11", "T03", "T02", "E32…
$ incident_number                <chr> "25008211", "25035733", "25006095", "25…
$ call_type                      <chr> "Alarms", "Alarms", "Alarms", "Elevator…
$ call_date                      <chr> "01/16/2025", "03/08/2025", "01/12/2025…
$ watch_date                     <chr> "01/15/2025", "03/08/2025", "01/11/2025…
$ received_dt_tm                 <chr> "2025 Jan 16 02:41:42 AM", "2025 Mar 08…
$ entry_dt_tm                    <chr> "2025 Jan 16 02:43:02 AM", "2025 Mar 08…
$ dispatch_dt_tm                 <chr> "2025 Jan 16 02:43:55 AM", "2025 Mar 08…
$ response_dt_tm                 <chr> "2025 Jan 16 02:46:32 AM", "2025 Mar 08…
$ on_scene_dt_tm                 <chr> NA, "2025 Mar 08 05:36:04 PM", "2025 Ja…
$ transport_dt_tm                <chr> NA, NA, NA, NA, NA, NA, NA, NA, NA, NA,…
$ hospital_dt_tm                 <chr> NA, NA, NA, NA, NA, NA, NA, NA, NA, NA,…
$ call_final_disposition         <chr> "Fire", "Other", "Fire", "Fire", "Fire"…
$ available_dt_tm                <chr> "2025 Jan 16 03:01:30 AM", "2025 Mar 08…
$ address                        <chr> "02ND ST/FOLSOM ST", "GREENWICH ST/STEI…
$ city                           <int> 17, 17, 17, 17, 17, 17, 17, 17, 15, 17,…
$ zipcode_of_incident            <dbl> 94107, 94123, 94110, 94109, 94108, 9413…
$ original_priority              <int> 3, 3, 3, 3, 3, 3, 3, 3, 3, 3, 3, 3, NA,…
$ priority                       <int> 3, 3, 3, 3, 3, 3, 3, 3, 3, 3, 3, 3, 3, …
$ final_priority                 <int> 2, 2, 2, 2, 2, 2, 2, 2, 2, 2, 2, 2, 2, …
$ als_unit                       <lgl> FALSE, FALSE, TRUE, FALSE, FALSE, FALSE…
$ call_type_group                <chr> "Alarm", "Alarm", "Alarm", "Alarm", "Al…
$ number_of_alarms               <dbl> 1, 1, 1, 1, 1, 1, 1, 1, 1, 1, 1, 1, 1, …
$ unit_type                      <chr> "TRUCK", "CHIEF", "ENGINE", "TRUCK", "T…
$ unit_sequence_in_call_dispatch <dbl> 3, 2, 1, 1, 2, 3, 2, 1, 2, 1, 1, 1, 3, …
$ neighborhoods_boundaries       <chr> "Financial District/South Beach", "Mari…
$ case_location                  <chr> "POINT (-122.396705177 37.785542131)", …
Strings
Replace a string
Replace a string
Replace a string
Replace a string
# A tibble: 369,089 × 1
   address_long
   <chr>
 1 02ND STREET/FOLSOM STREET
 2 GREENWICH STREET/STREETEINER STREET
 3 MISSION STREET/POWERS AVE
 4 OCTAVIA STREET/SUTTER STREET
 5 SACRAMENTO STREET/WAVERLY PL
 6 CARRIE STREET/WILDER STREET
 7 CLIFFORD TER/UPPER TER
 8 18TH STREET/HARTFORD STREET
 9 MERRIE WAY/POINT LOBOS AVE
10 LOMBARD STREET/MASON STREET
# ℹ 369,079 more rows
Replace a string
# A tibble: 369,089 × 1
   address_long
   <chr>
 1 02ND STREET/FOLSOM STREET
 2 GREENWICH STREET/STREETEINER STREET
 3 MISSION STREET/POWERS AVENUE
 4 OCTAVIA STREET/SUTTERRACE STREET
 5 SACRAMENTO STREET/WAVENUERLY PLACE
 6 CARRIE STREET/WILDER STREET
 7 CLIFFORD TERRACE/UPPER TERRACE
 8 18TH STREET/HARTFORD STREET
 9 MERRIE WAY/POINT LOBOS AVENUE
10 LOMBARD STREET/MASON STREET
# ℹ 369,079 more rows
Regular expressions
# A tibble: 369,089 × 1
   address_long
   <chr>
 1 02ND STREET/FOLSOM STREET
 2 GREENWICH STREET/STEINER STREET
 3 MISSION STREET/POWERS AVENUE
 4 OCTAVIA STREET/SUTTER STREET
 5 SACRAMENTO STREET/WAVERLY PLACE
 6 CARRIE STREET/WILDER STREET
 7 CLIFFORD TERRACE/UPPER TERRACE
 8 18TH STREET/HARTFORD STREET
 9 MERRIE WAY/POINT LOBOS AVENUE
10 LOMBARD STREET/MASON STREET
# ℹ 369,079 more rows
Change letter types
# A tibble: 6 × 1
  address
  <chr>
1 02nd St/Folsom St
2 Greenwich St/Steiner St
3 Mission St/Powers Ave
4 Octavia St/Sutter St
5 Sacramento St/Waverly Pl
6 Carrie St/Wilder St
We can also use str_to_upper() or str_to_lower() as needed
glue
# A tibble: 3 × 1
  description
  <glue>
1 Incident 250160183 occurred in Financial District/South Beach
2 Incident 250672403 occurred in Marina
3 Incident 250120282 occurred in Bernal Heights
detect
# A tibble: 10 × 2
   call_type                     is_fire_related
   <chr>                         <lgl>
 1 Alarms                        FALSE
 2 Alarms                        FALSE
 3 Alarms                        FALSE
 4 Elevator / Escalator Rescue   FALSE
 5 Alarms                        FALSE
 6 Traffic Collision             FALSE
 7 Alarms                        FALSE
 8 Vehicle Fire                  TRUE
 9 Smoke Investigation (Outside) TRUE
10 HazMat                        FALSE
Dates
ISO Date
Note
While there are many ways to write a date for humans, there is only one universally accepted format for data as standardized by the International Organization for Standardization (ISO). It follows the order of YYYY-MM-DD (e.g., 1986-12-20). Writing dates this way ensures they are sorted correctly by computers and avoids any international confusion between months and days.
UTC and Timezones
UTC stands for Coordinated Universal Time. Think of it as the world’s main clock.
UTC is not a timezone but a high-precision time standard that all time zones use to stay synchronized.
UTC never observes Daylight Saving Time, it never skips or repeats hours, making it the safest format for storing data and performing math.
Cambridge is UTC-5 (5 hours behind UTC) between first Sunday of November and second Sunday of March which is specified as Eastern Standard Time (EST) and UTC-4 during rest of the year which is specified as Eastern Daylight Time (EDT).
received_dt_tm
ymd_hms()
received_dt_tm
with time zone
# A tibble: 3 × 1
  received_dt_tm
  <dttm>
1 2025-01-15 18:41:42
2 2025-03-08 09:28:54
3 2025-01-11 18:19:44
OlsonNames() function lists different names of timezones.
hour, month and week day
# A tibble: 3 × 4
  received_dt_tm      hour_val month_val day_name
  <dttm>                 <int> <ord>     <ord>
1 2025-01-15 18:41:42       18 Jan       Wed
2 2025-03-08 09:28:54        9 Mar       Sat
3 2025-01-11 18:19:44       18 Jan       Sat
duration
# A tibble: 3 × 2
  received_dt_tm      goal_arrival_time
  <dttm>              <dttm>
1 2025-01-15 18:41:42 2025-01-15 18:49:42
2 2025-03-08 09:28:54 2025-03-08 09:36:54
3 2025-01-11 18:19:44 2025-01-11 18:27:44
duration
[1] "2026-03-08 06:00:00 PDT"[1] "2026-03-08 05:00:00 PDT"Note
When performing math with dates, lubridate distinguishes between two ways of measuring time: durations and periods. This distinction is critical when your data spans a Daylight Saving Time (DST) transition. The above example shows a hypothetical event start time as March 7th, 2026 at 5:00 in Los Angeles time zone. When you add duration of exactly 1 day using the ddays() function, you are simply adding 86,400 seconds. When 86,400 seconds have passed the clocks would be showing 06:00 am on March 8th, 2026 due to start of Daylight Saving Time. On the other end, the days() function just adds one day to the calendar day without touching the time component.
difftime
today and now
Factors
as.factor()
levels()
levels() as seen in ggplot
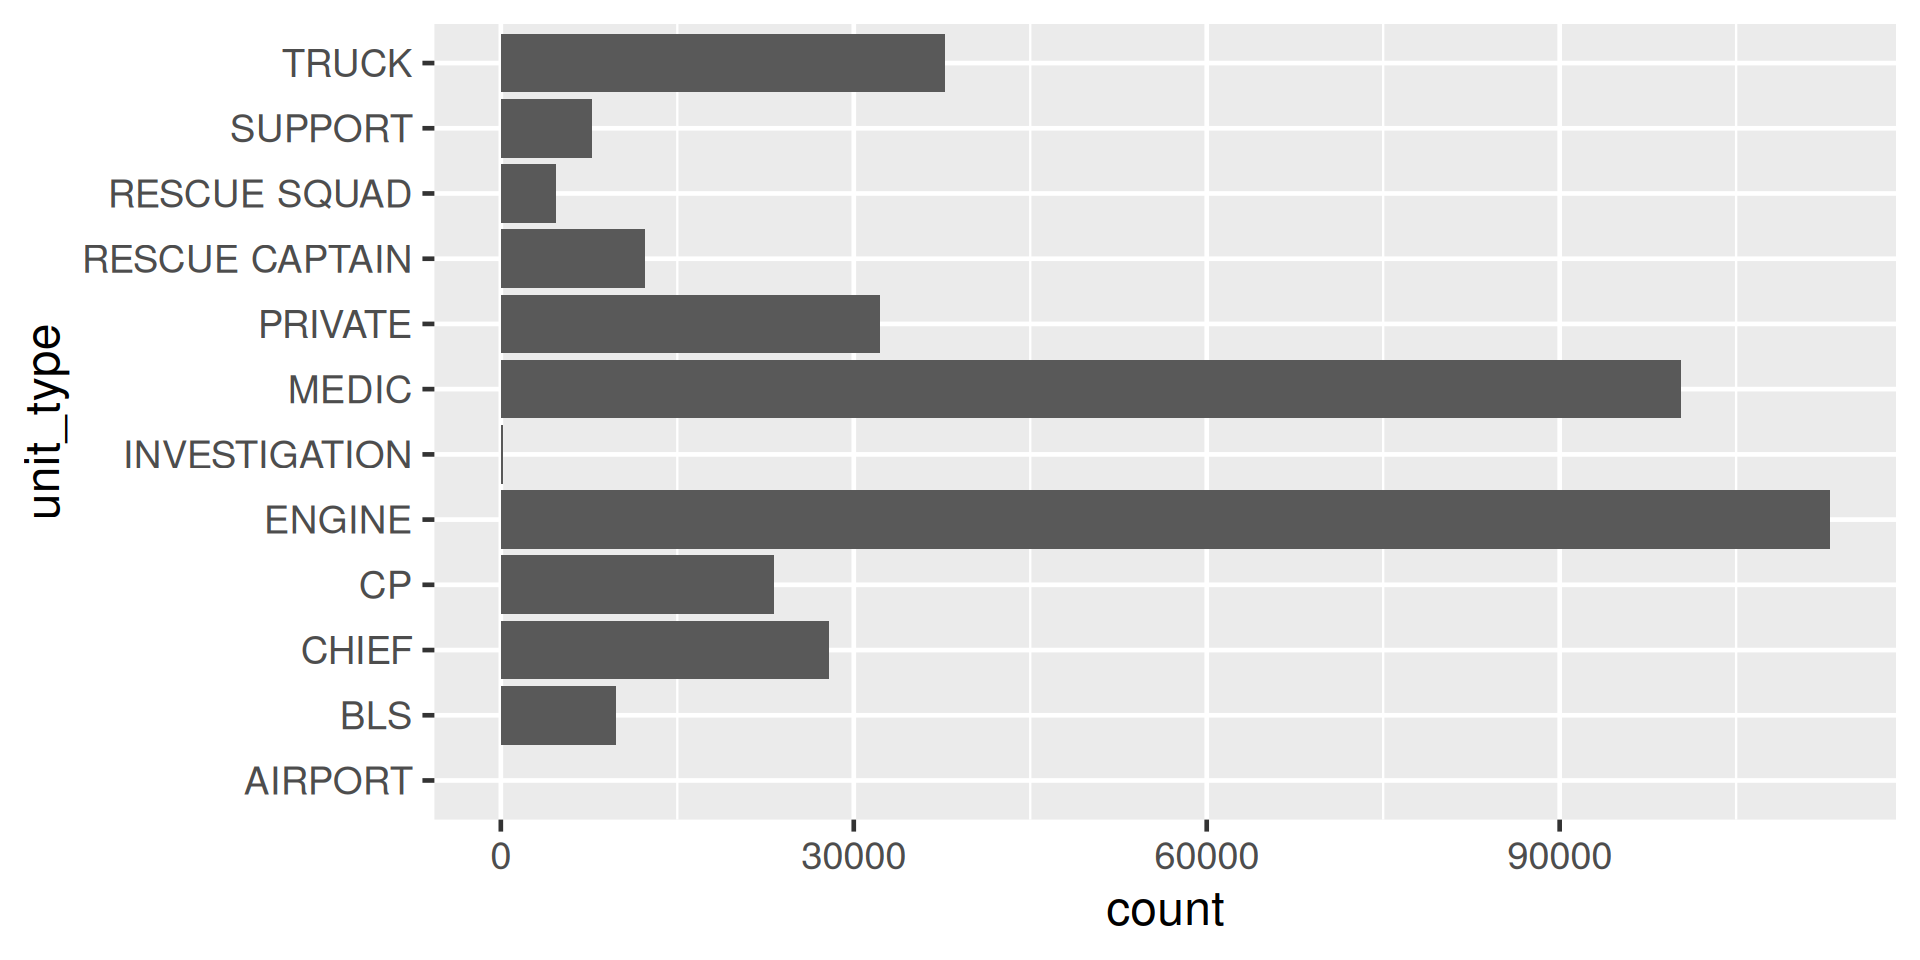
Figure 1
fct_infreq()
levels() as seen in ggplot
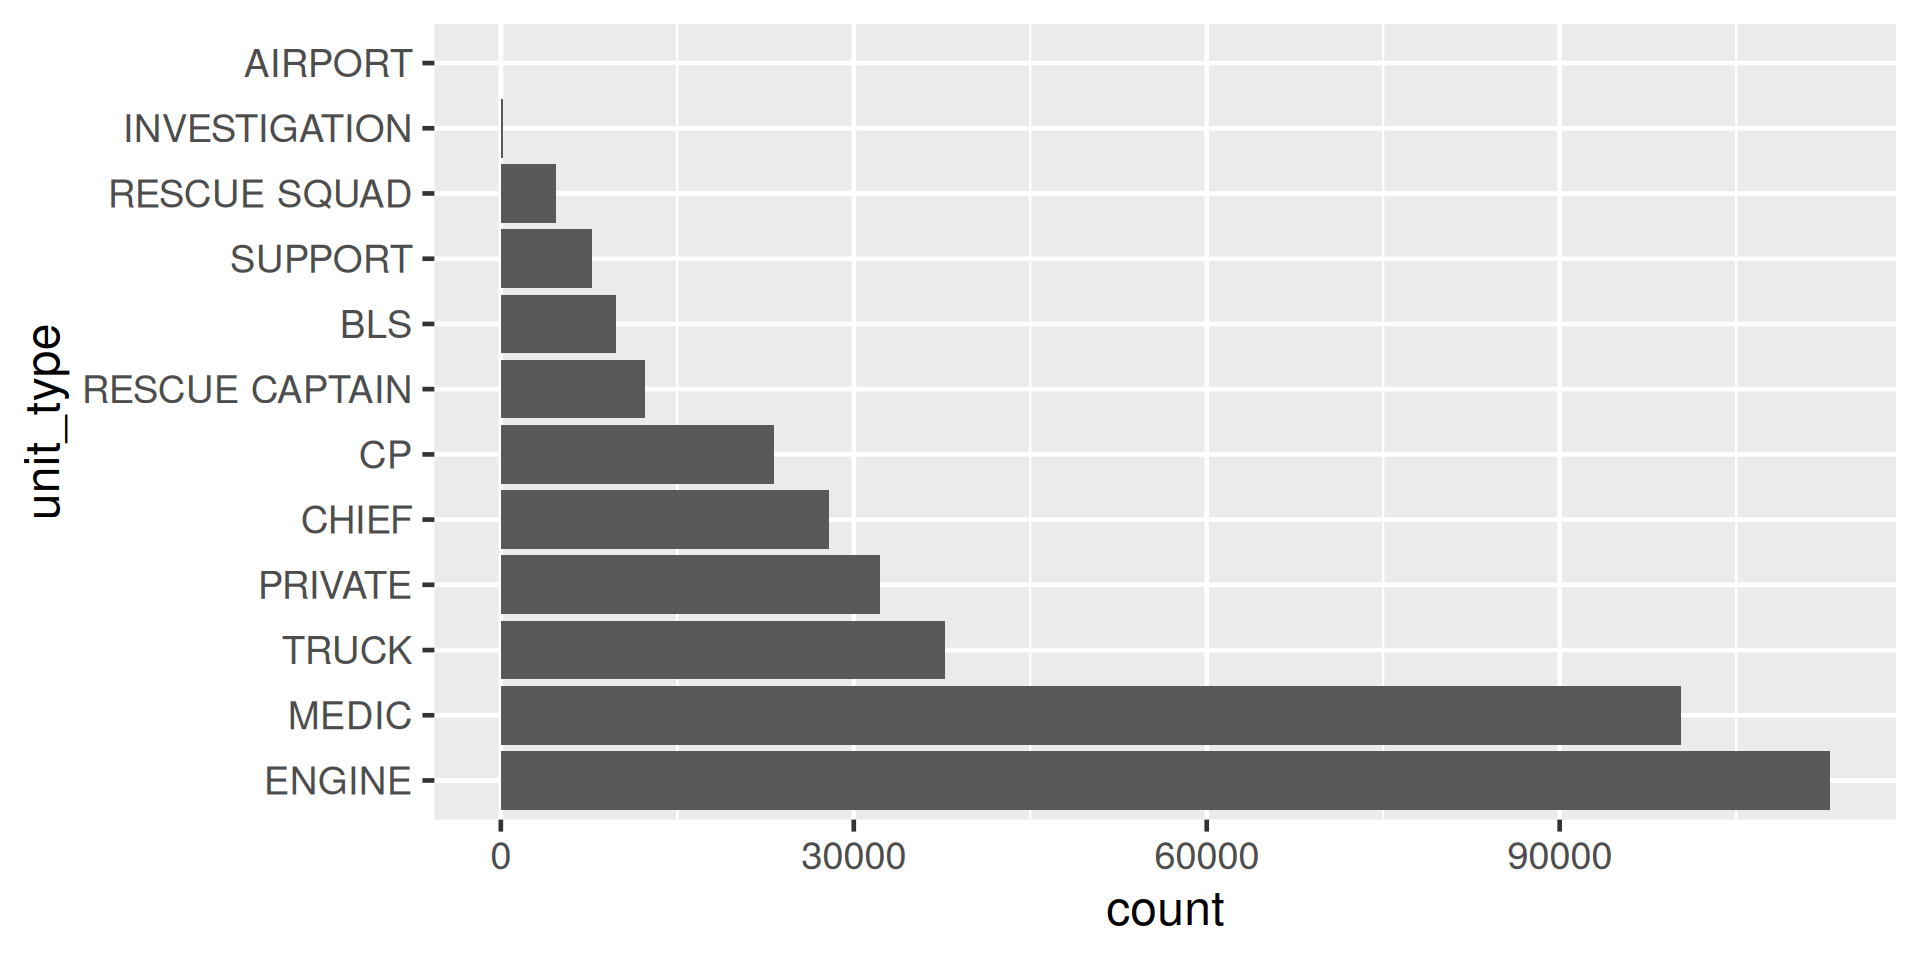
Figure 2
levels() as seen in ggplot with fct_rev()
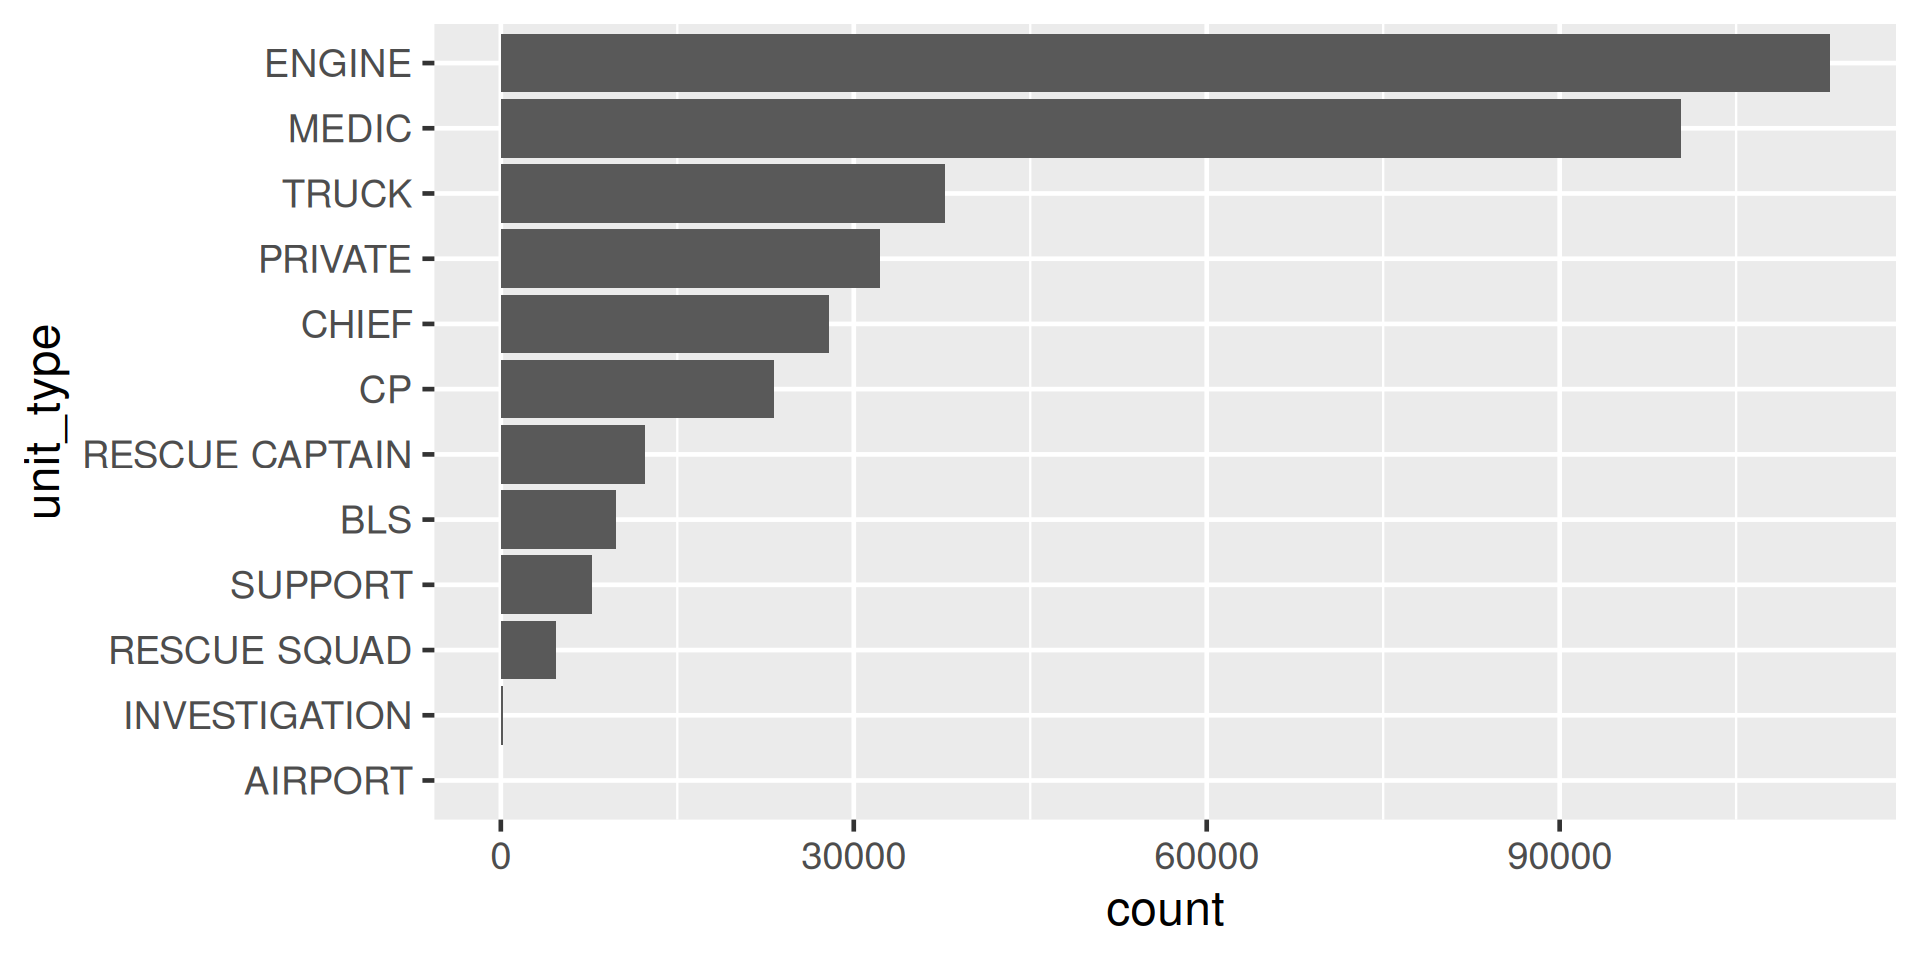
Figure 3
levels() as seen in ggplot with fct_lump_n()
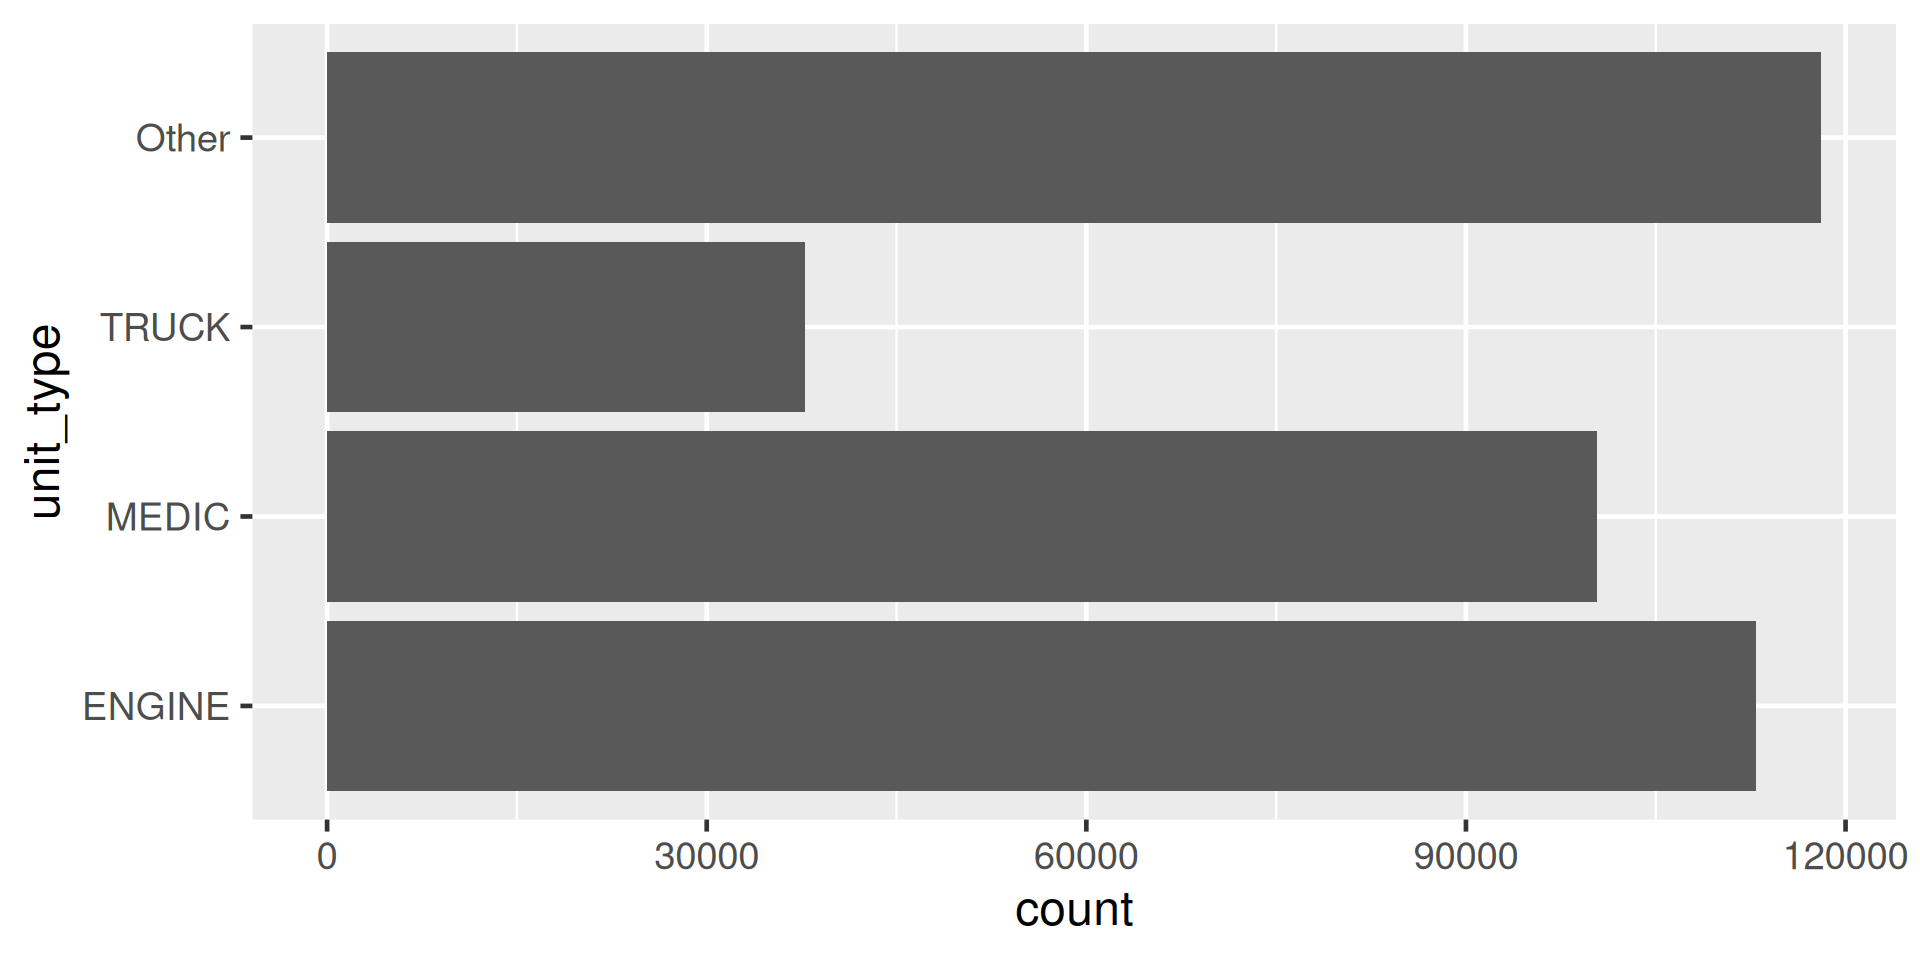
Figure 4
fct_relevel()
# A tibble: 12 × 2
   unit_type      total_als_unit
   <fct>                   <int>
 1 ENGINE                  89853
 2 MEDIC                   88065
 3 TRUCK                    2336
 4 PRIVATE                     0
 5 CHIEF                       0
 6 CP                        135
 7 RESCUE CAPTAIN           9821
 8 BLS                         0
 9 SUPPORT                  5059
10 RESCUE SQUAD                0
11 INVESTIGATION               0
12 AIRPORT                     0
fct_relevel()
# A tibble: 12 × 2
   unit_type      total_als_unit
   <fct>                   <int>
 1 ENGINE                  89853
 2 TRUCK                    2336
 3 MEDIC                   88065
 4 PRIVATE                     0
 5 CHIEF                       0
 6 CP                        135
 7 RESCUE CAPTAIN           9821
 8 BLS                         0
 9 SUPPORT                  5059
10 RESCUE SQUAD                0
11 INVESTIGATION               0
12 AIRPORT                     0
fct_reorder()
 Factor w/ 42 levels "Bayview Hunters Point",..: 6 17 2 13 4 7 3 3 27 24 ...
 Factor w/ 42 levels "Nob Hill","Western Addition",..: 27 20 26 14 8 34 15 15 16 23 ...