data/raw/: data exactly as downloaded; never edit these files
data/processed/: cleaned data created by code
data/clean-data.qmd: code that turns raw/ into processed/
paper/: your paper and references (starting in Milestone 2)
Reproducibility
A project is computationally reproducible when an independent data scientist (or you, a few months from now) can take your exact data, source code, and software environment, rerun the entire pipeline, and obtain the exact same results, figures, and tables.
Essentially, it means you have tracked your steps clearly enough that your claims can be verified by others or by your future self.
Habits for a reproducible project
Never edit raw data by hand. Files in data/raw/ stay exactly as you downloaded them.
Do all cleaning in code. Filtering, selecting variables, renaming, recoding, handling missing values, and joining all happen in data/clean-data.qmd, which reads from data/raw/ and writes to data/processed/.
Use the here package for file paths so that your code runs on anyone’s computer.
Make sure your code runs from start to finish on a fresh copy of the repository without errors.
The here package
# works only on one computerread_csv("/Users/mine/Desktop/project-team07/data/processed/my-data.csv")# works on everyone's computerread_csv(here::here("data/processed/my-data.csv"))
here::here() builds file paths starting from the project folder (where the .Rproj file is), no matter which subfolder your .qmd file is in. So the same path works in data/clean-data.qmd and in paper/paper.qmd.
Naming files
1. Be Descriptive and Concise
Use names that clearly indicate the file’s content or purpose.
Avoid vague names like Untitled.qmd or document.qmd.
Following the tidyverse style guide, we use snake_case for object names in R and kebab-case for file and folder names.
3. Avoid Special Characters and Spaces
Do not use spaces, slashes (/ or \), colons (:), asterisks (*), question marks (?), or quotes.
Spaces can cause issues in some systems. Use hyphens (or underscores) instead.
4. Include Dates When Relevant
Use the ISO 8601 format (YYYY-MM-DD) so that files sort in chronological order.
Example: meeting-notes-2026-10-05.md
5. Use Numbers and/or Letters for Easy Sorting
Start file names with numbers and/or letters so they sort in the order you use them.
Example: 01b-intro-tools.qmd, 02b-intro-data.qmd
01 represents the week of the term
a represents Monday and b represents Wednesday
Use leading zeros (01, 02, …, 10). Otherwise 10-... would be sorted before 2-....
README files
README.md
A README file is the first file people read. In our case, a reader might be our future self, a teammate, a course assistant, or (if the repo is public) anyone.
It should be brief but detailed enough to help readers navigate the project.
There can be multiple README files in a project: e.g., one for the whole project folder and another for the data subfolder. A data README can contain the codebook (data dictionary).
README.md
A README should be up to date. Update it throughout the project’s life cycle as needed.
On GitHub, we write README files in Markdown (README.md). Good news: emojis are supported.
Data Navigator, a custom GPT in Harvard’s ChatGPT Edu environment. Verify that any data set it suggests actually exists.
You are not limited to using only these resources.
Host vs. source
Not all publicly available data are real. There are many artifical datasets on some sites (e.g., Kaggle).
The host is the site you download the data from.
The source is the person or organization that actually collected the data.
Before you commit to a data set, trace it back to its original source and make sure the data are real, the source is credible, and you can find out how the data were collected.
Data documentation
data/README.md is the perfect place to document your data. It should include
Source and citation: who created the data, where you downloaded it from (URL), and when you downloaded it. The retrieval date is important because data can get updated. For instance, the data might be published by the City of Cambridge or a group of researchers at MIT but hosted by Kaggle. Cite the original source and where the data are hosted.
How the data were collected: who or what was measured, when, where, how, and why.
Data documentation
Observational unit: what one row represents (a person, a county, a song, a game, a day).
Files: every file in data/raw/ and data/processed/, with a one-line description and its number of rows and columns.
Codebook: a table describing each variable you plan to use.
Processing steps: a short summary of what your cleaning code does to get from raw/ to processed/.
License or terms of use, if the source lists one.
Codebook example
The gapminder data from the gapminder R package:
Variable
Description
Type
Units or values
country
Name of the country
categorical
142 countries
continent
Continent of the country
categorical
Africa, Americas, Asia, Europe, Oceania
year
Year of the measurement
numerical
1952 to 2007, every 5 years
lifeExp
Life expectancy at birth
numerical
years
pop
Population
numerical
number of people
gdpPercap
GDP per capita
numerical
US$, inflation-adjusted
Also note how missing values are coded. Some surveys use codes like 77, 99, or -1 for “don’t know” or “refused.”
Collaboration on GitHub
Collaboration on GitHub
Collaboration on GitHub
Collaboration on GitHub
Collaboration on GitHub
Collaboration on GitHub
Collaboration on GitHub
Collaboration on GitHub
Collaboration on GitHub
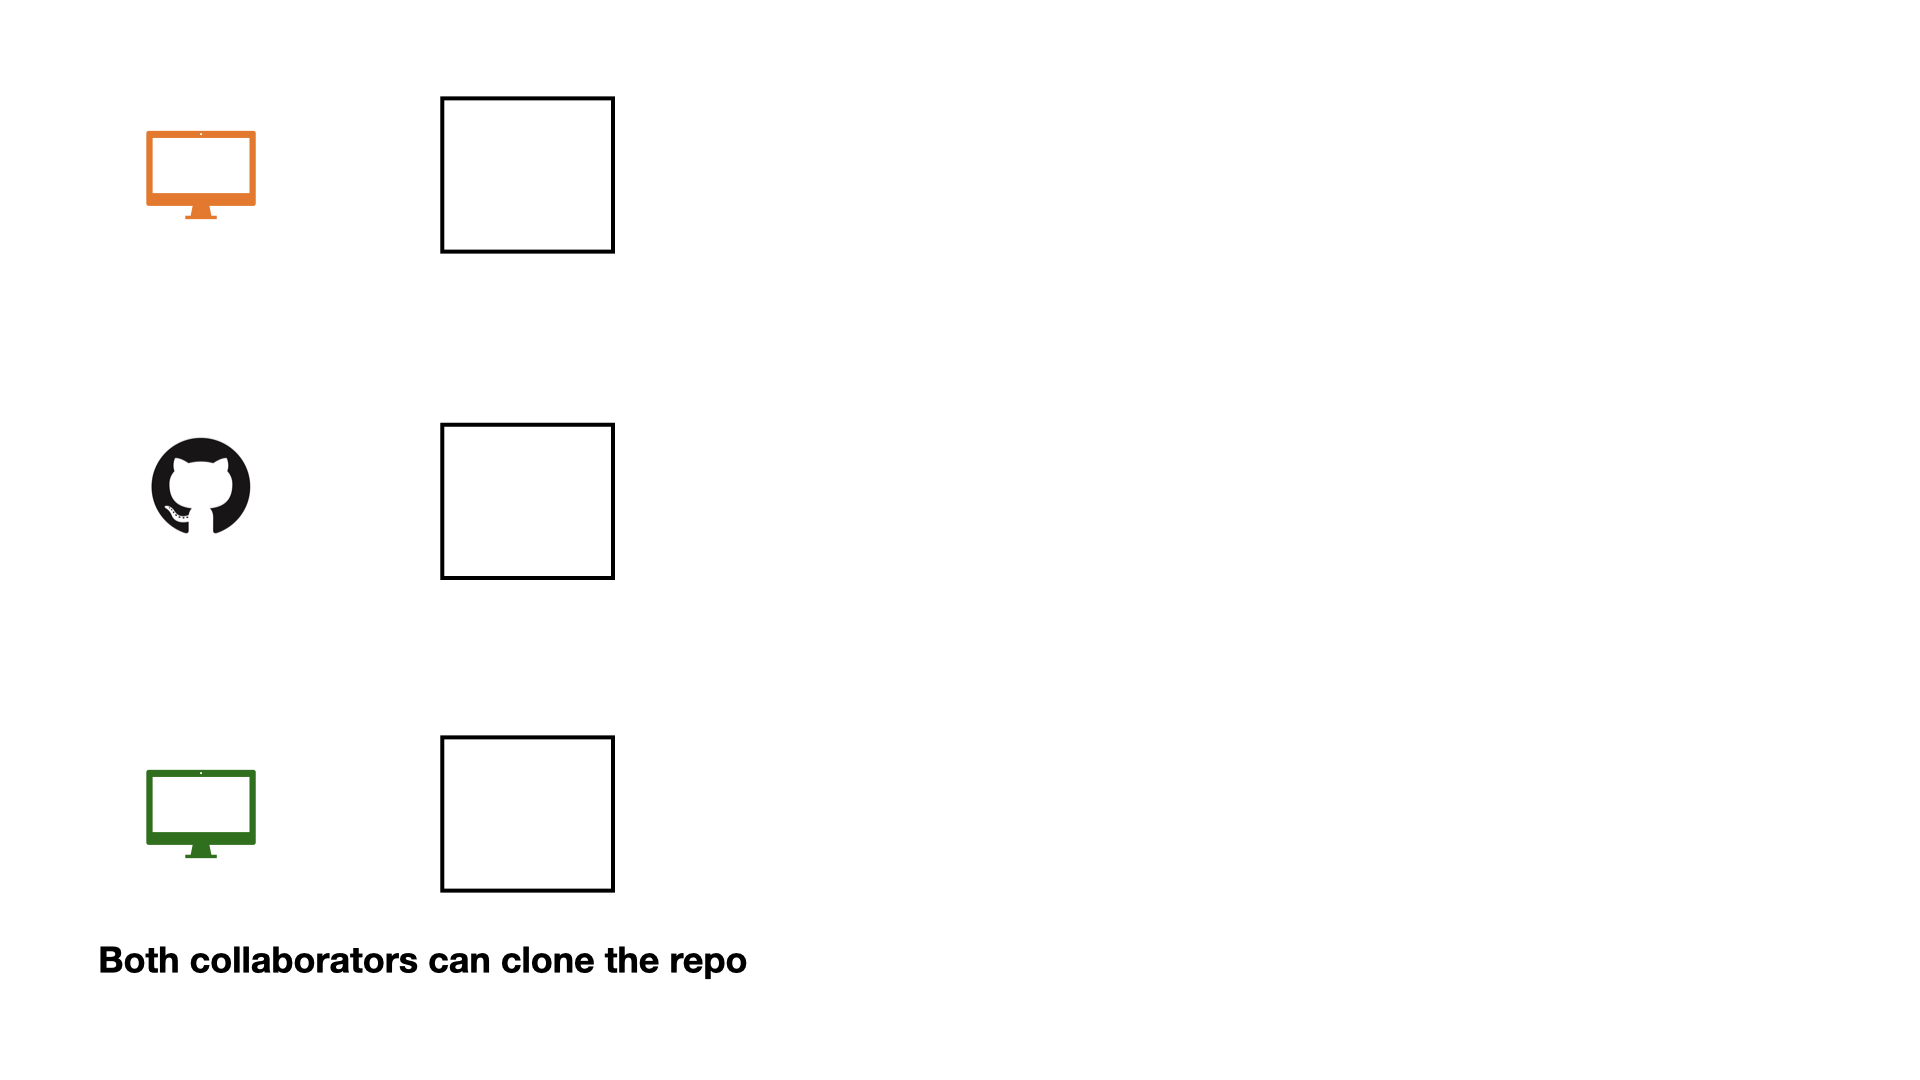
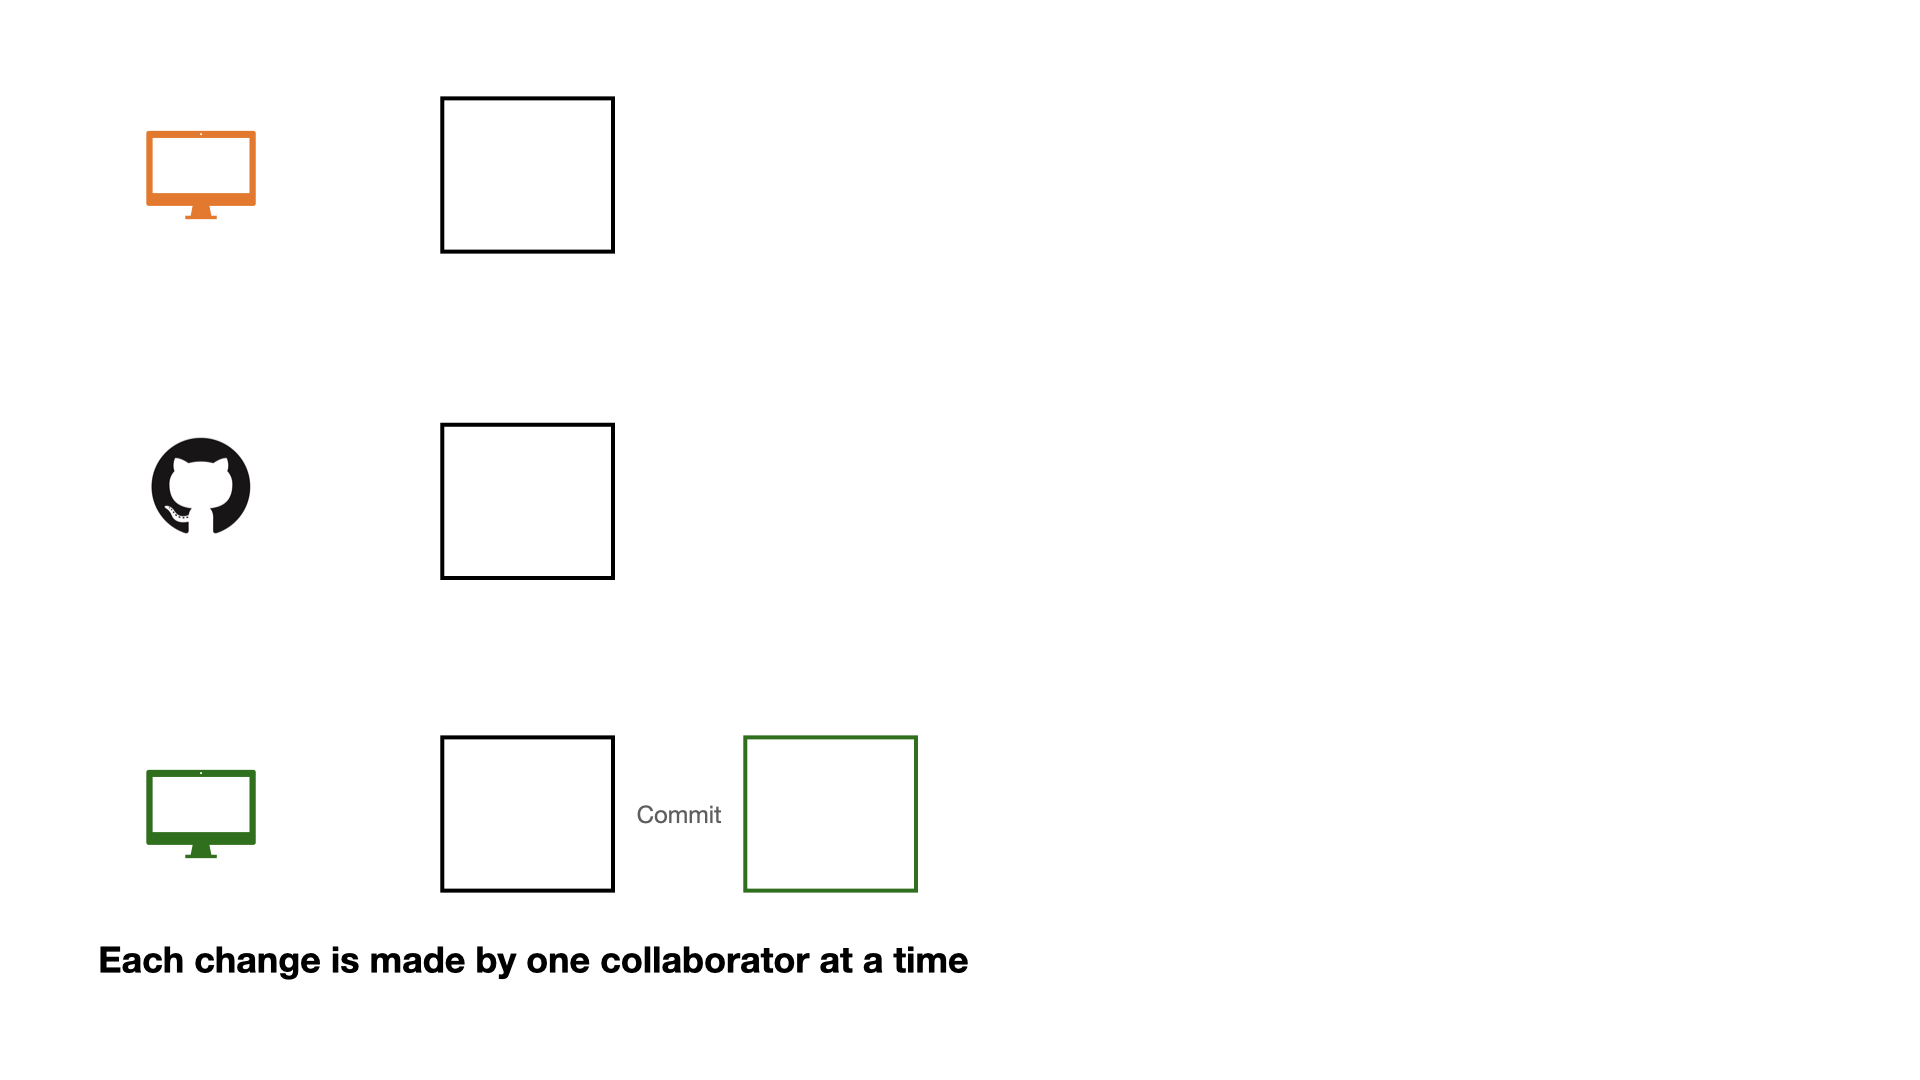
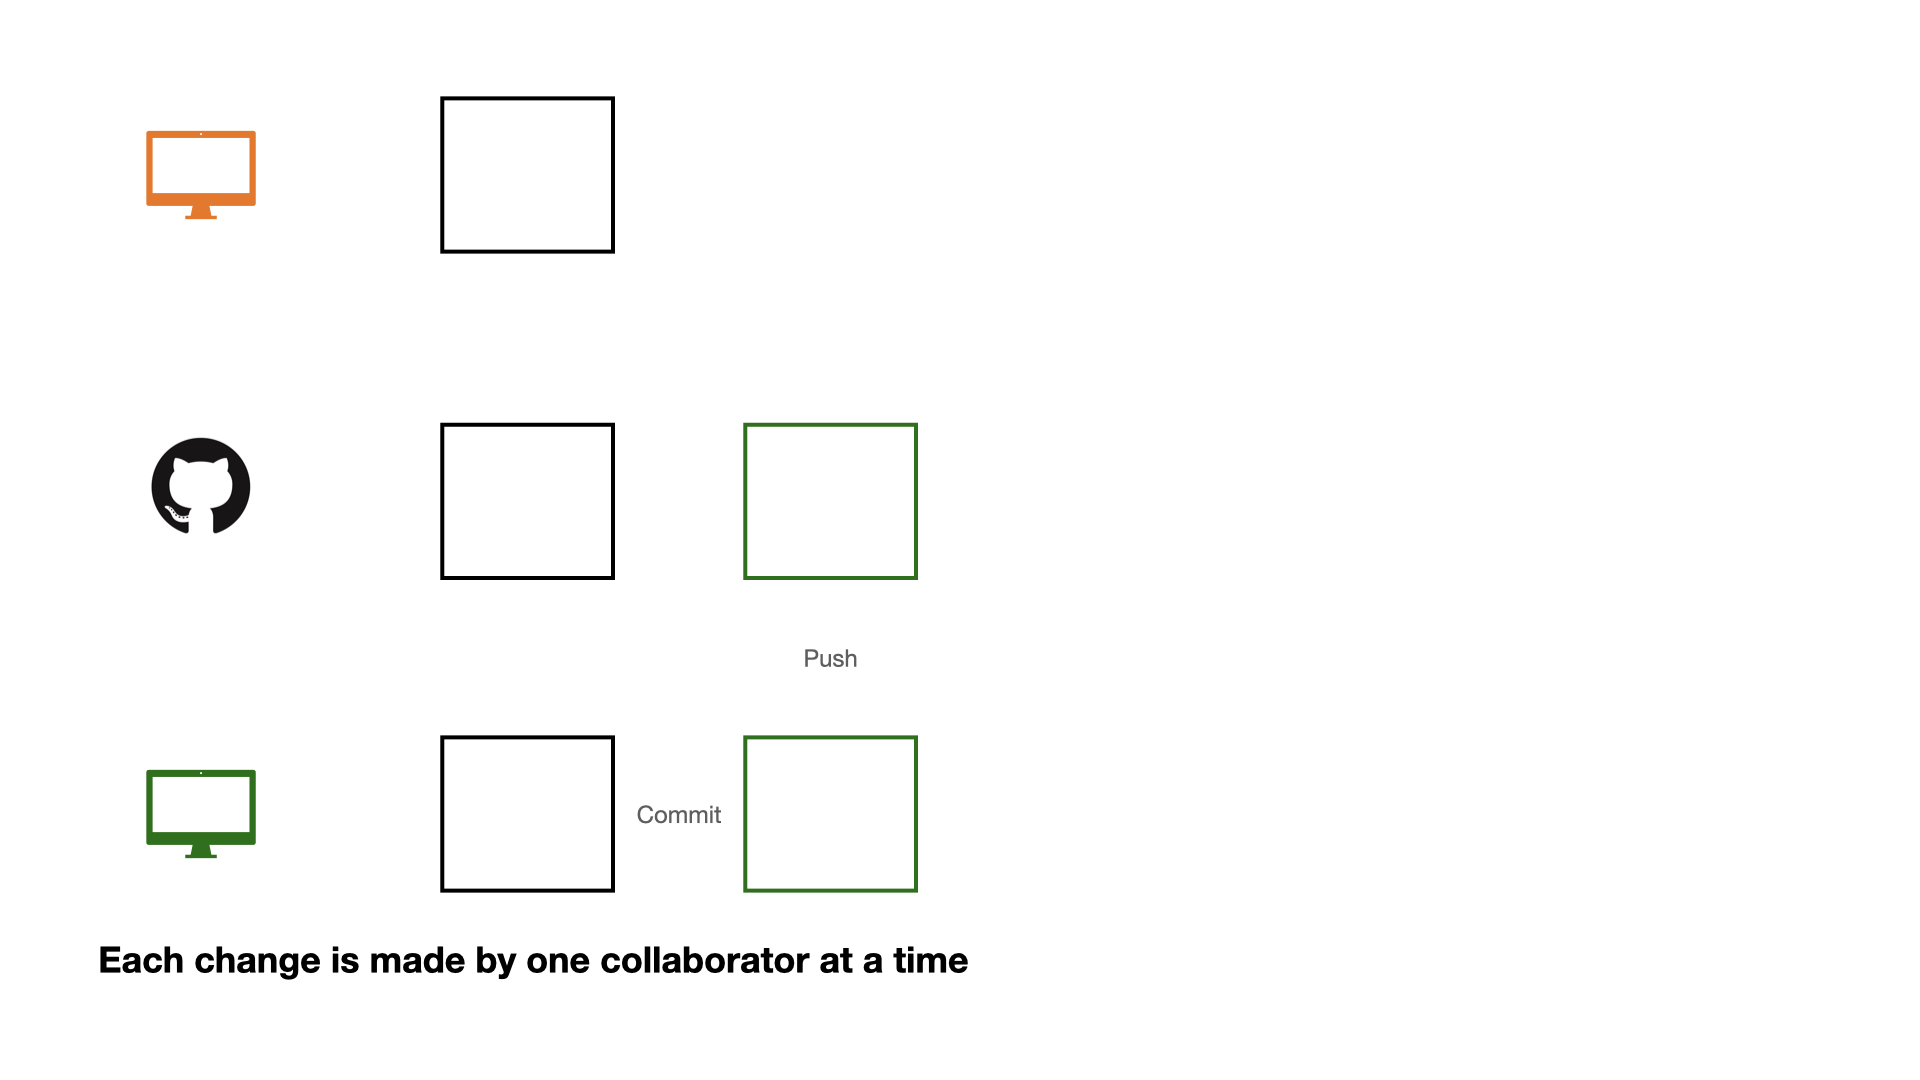
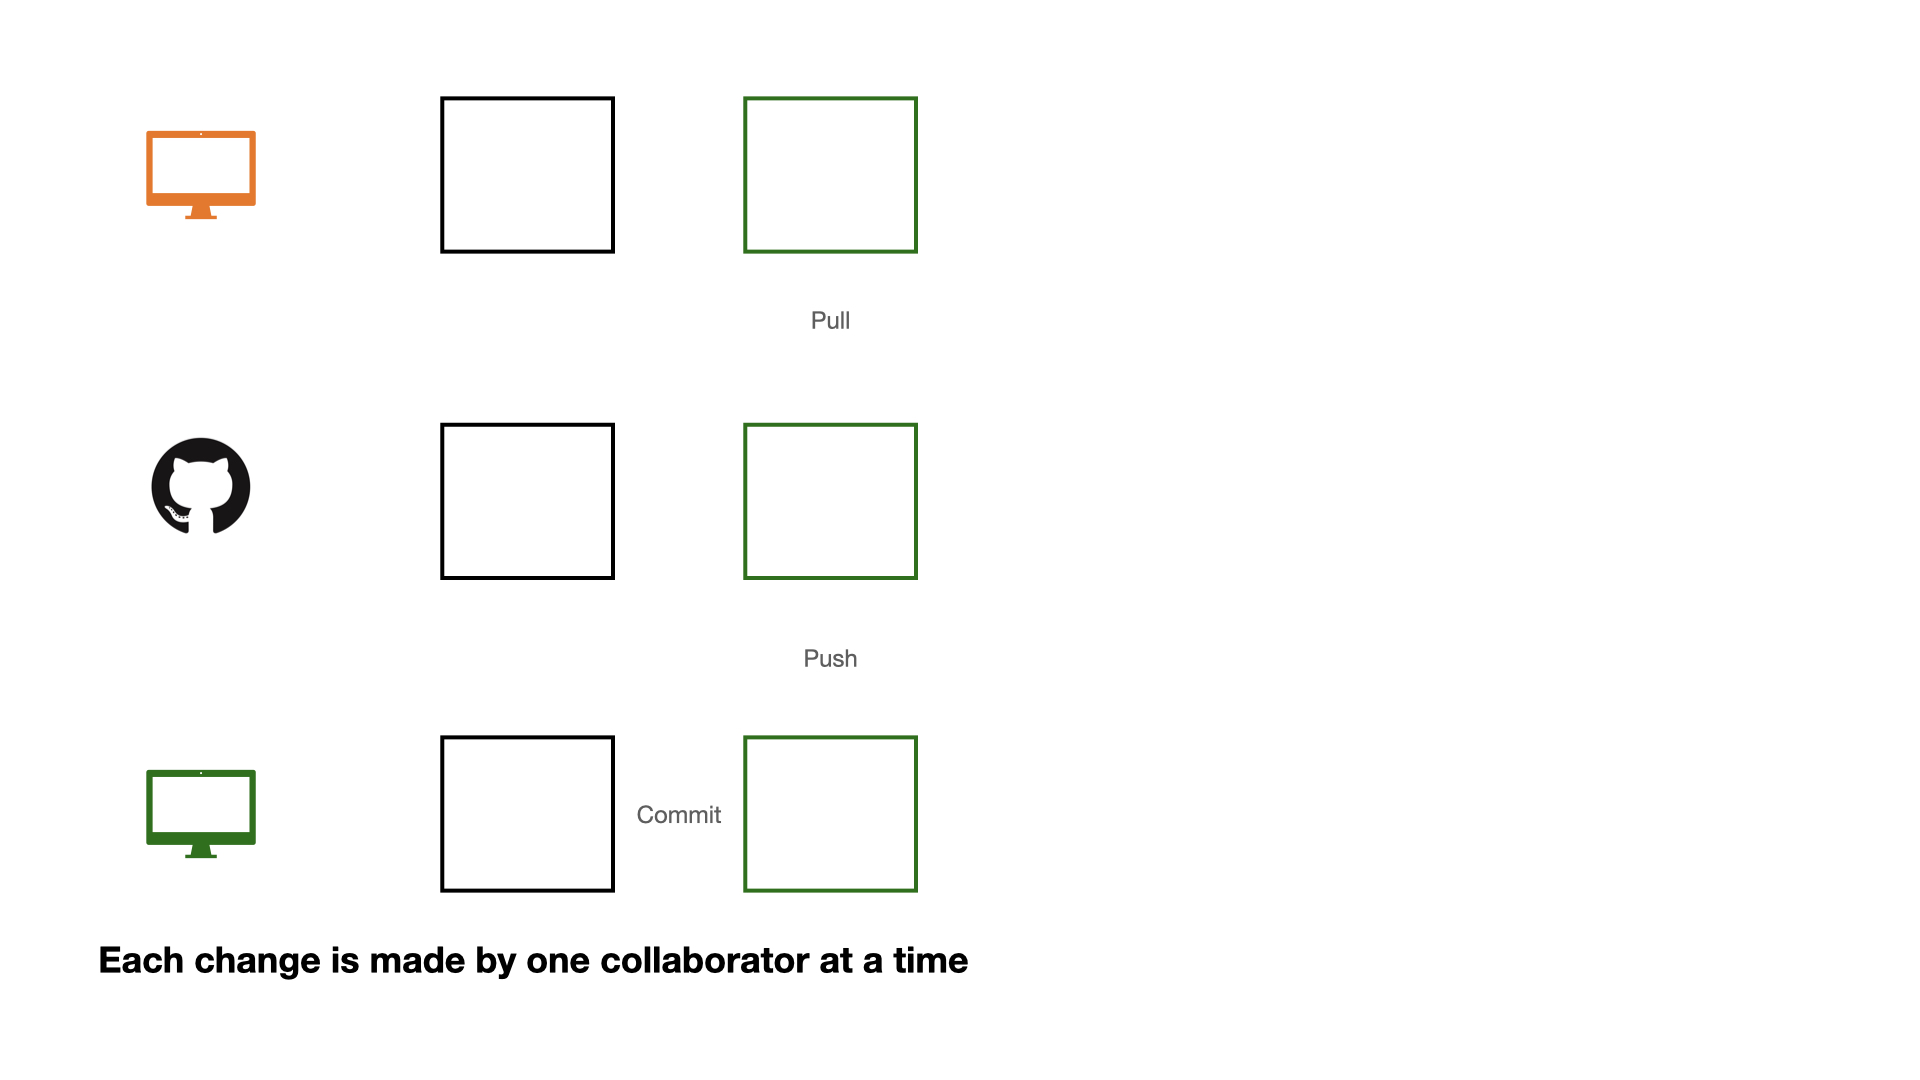
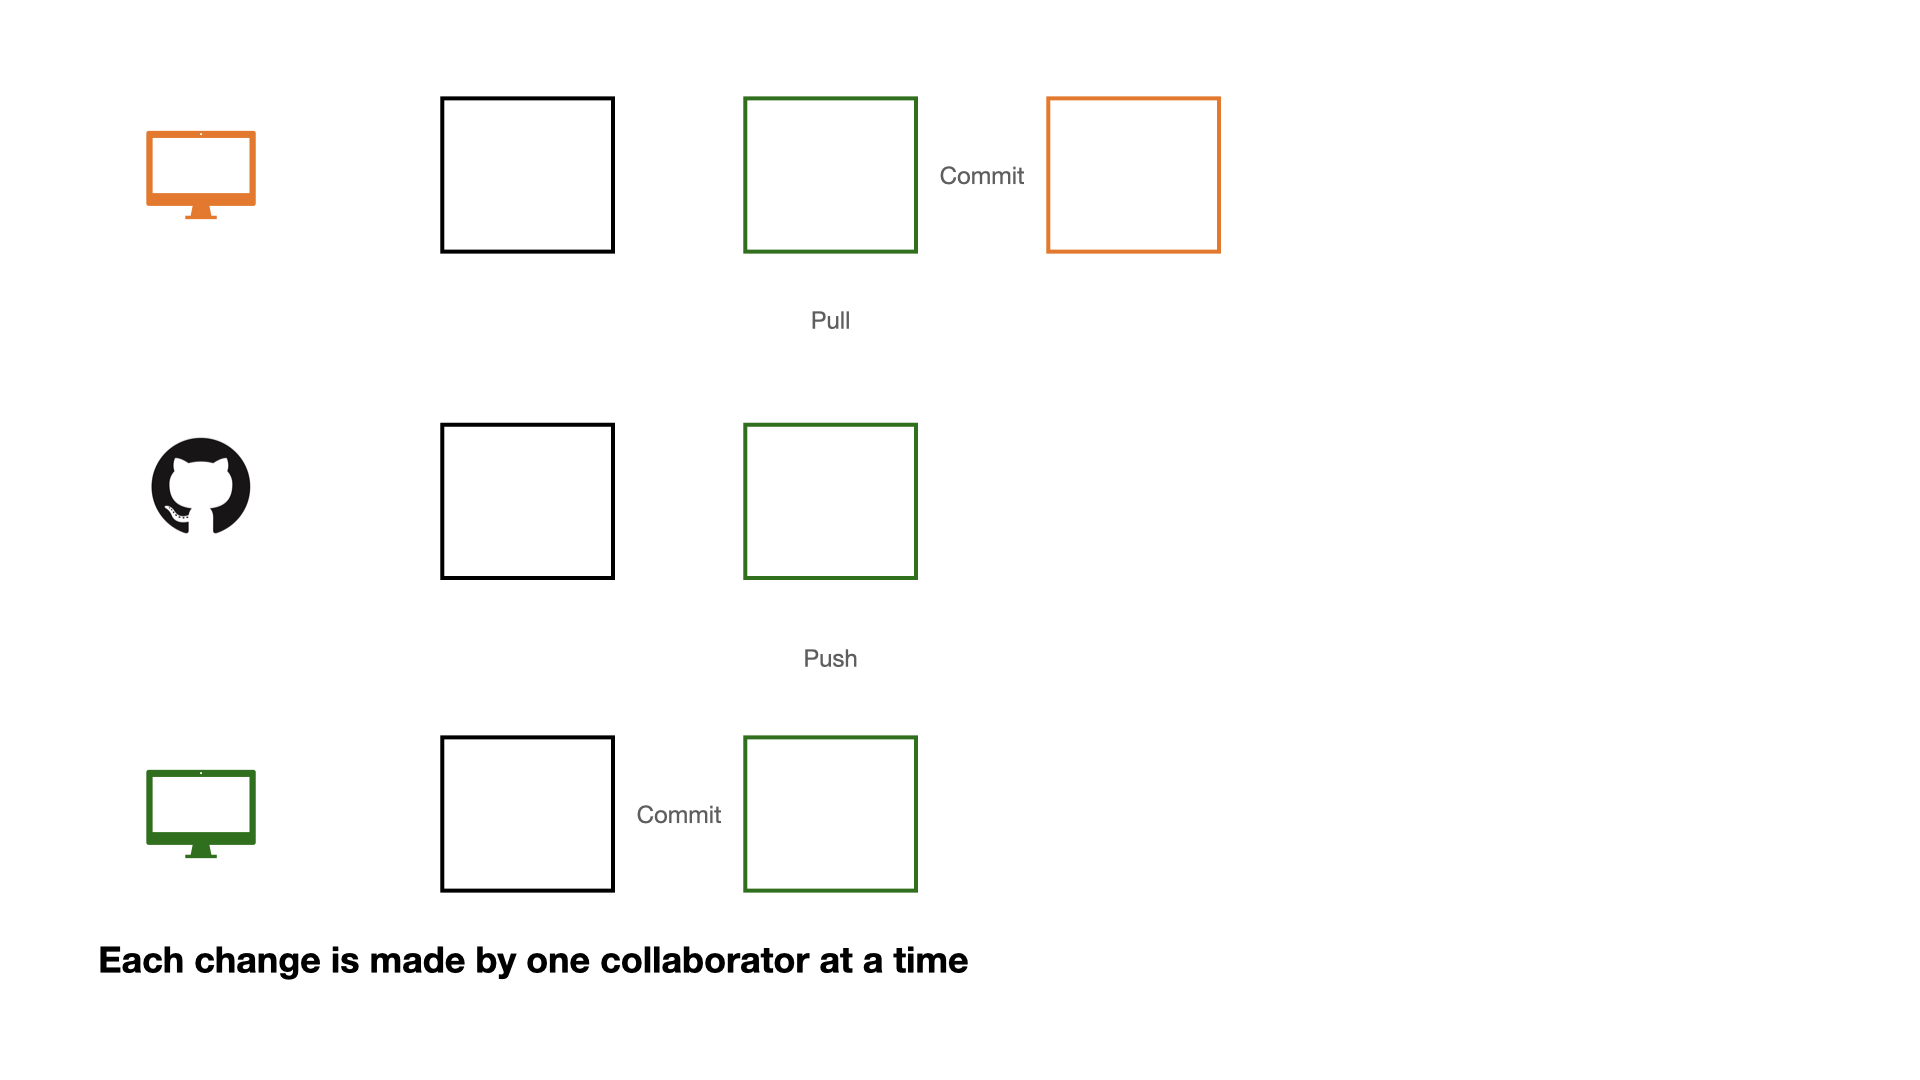
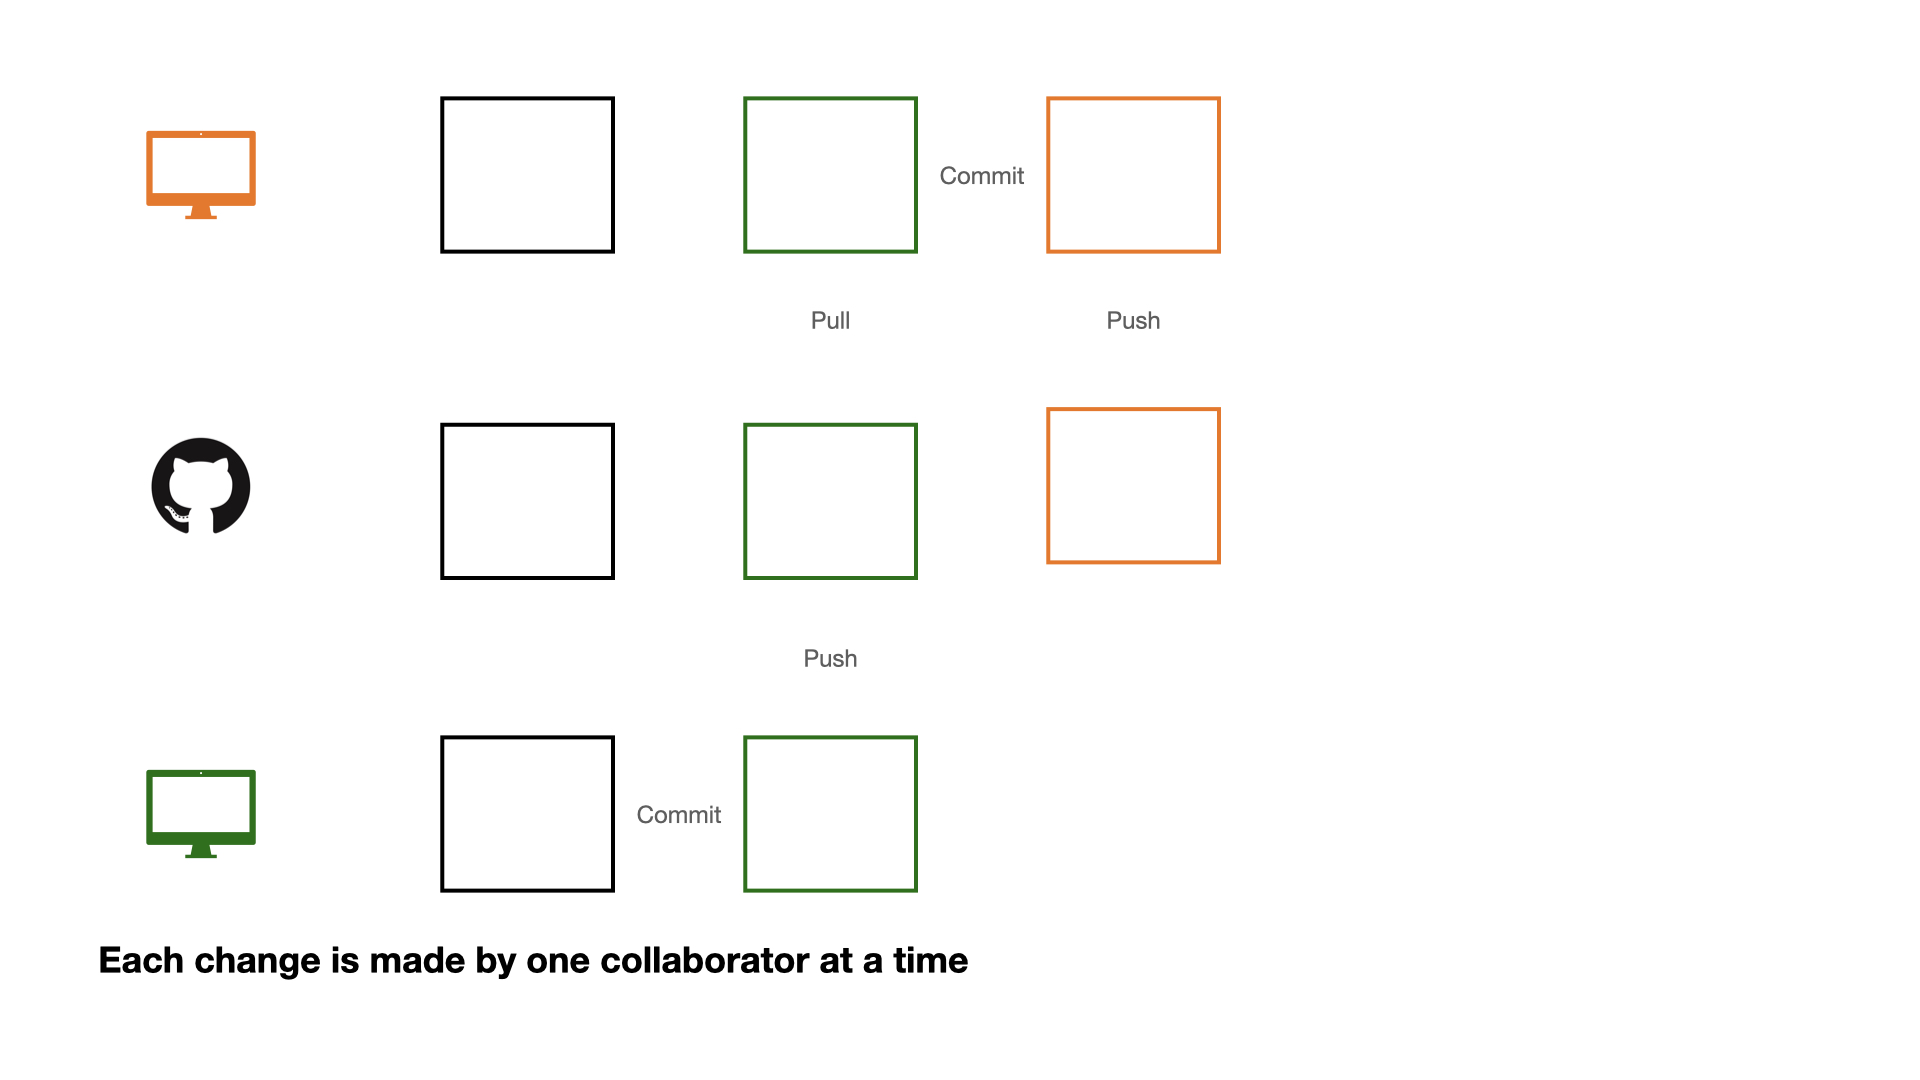
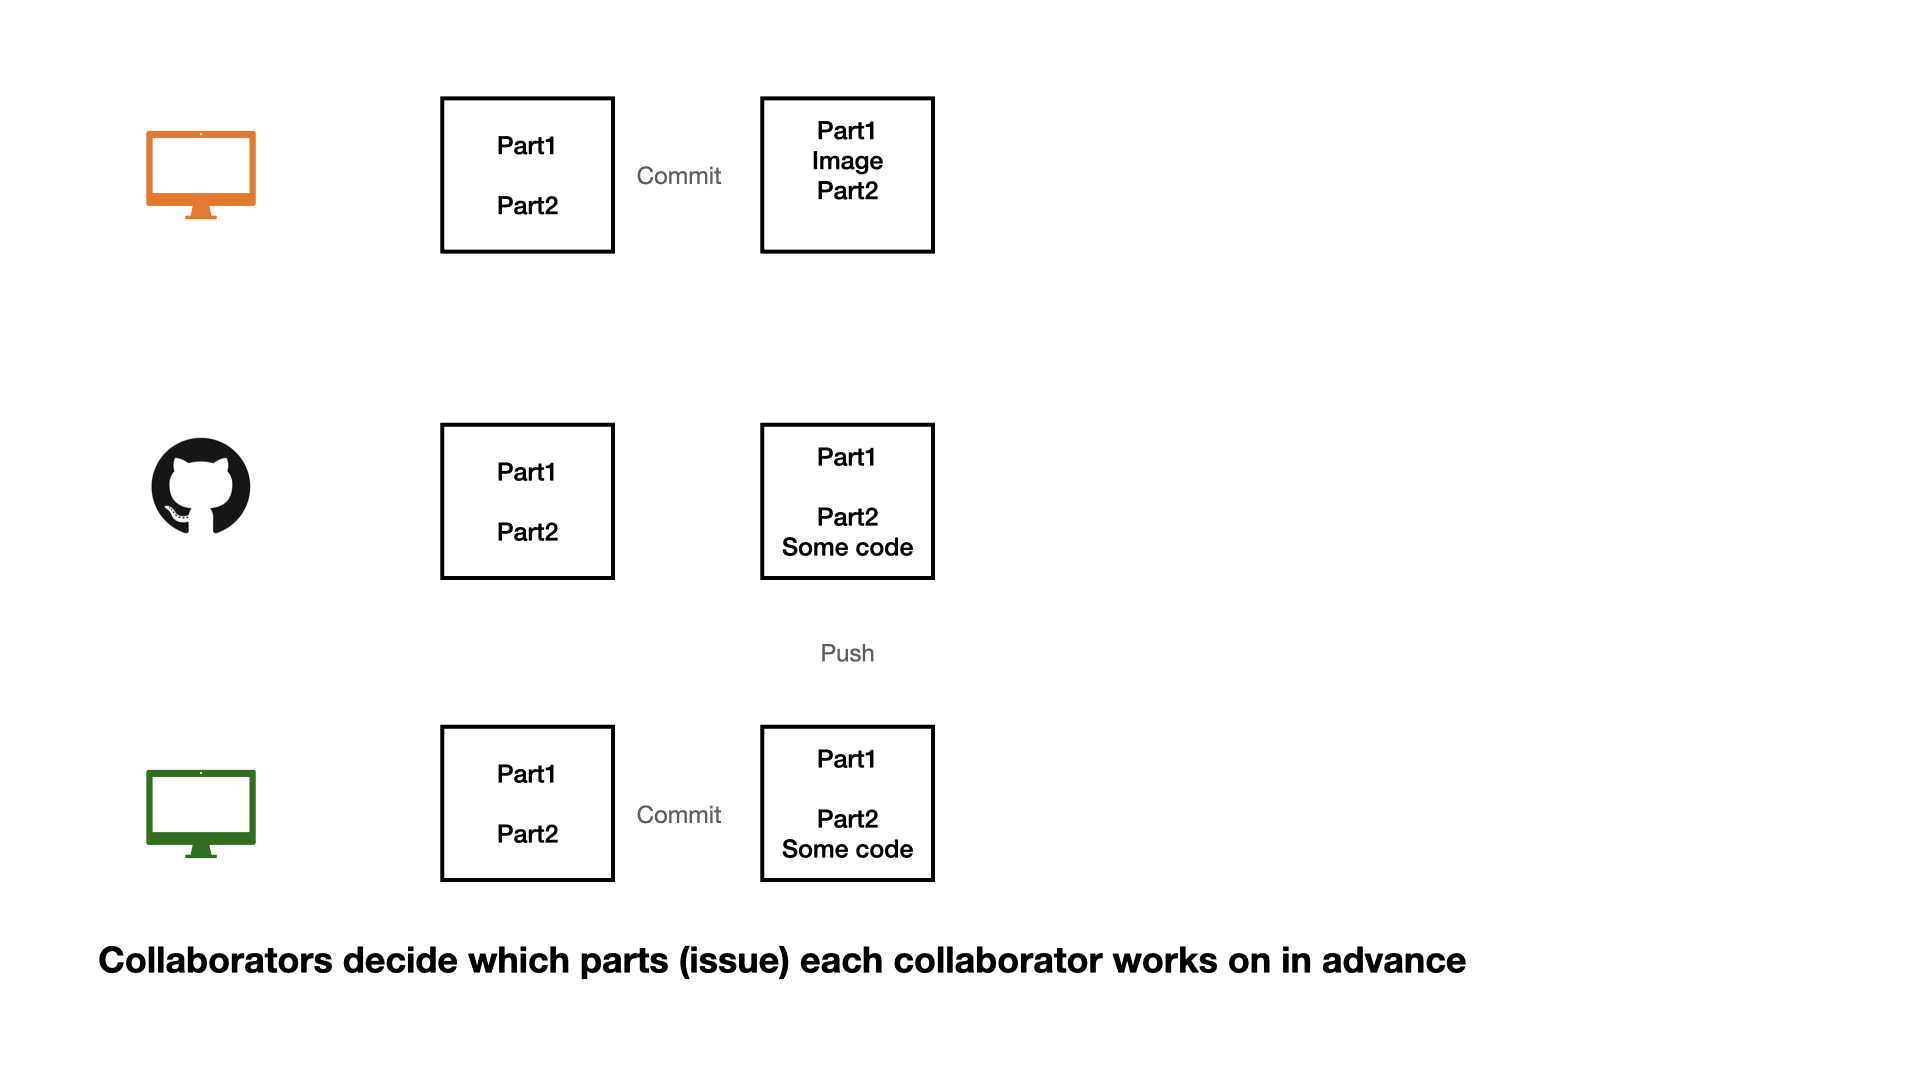
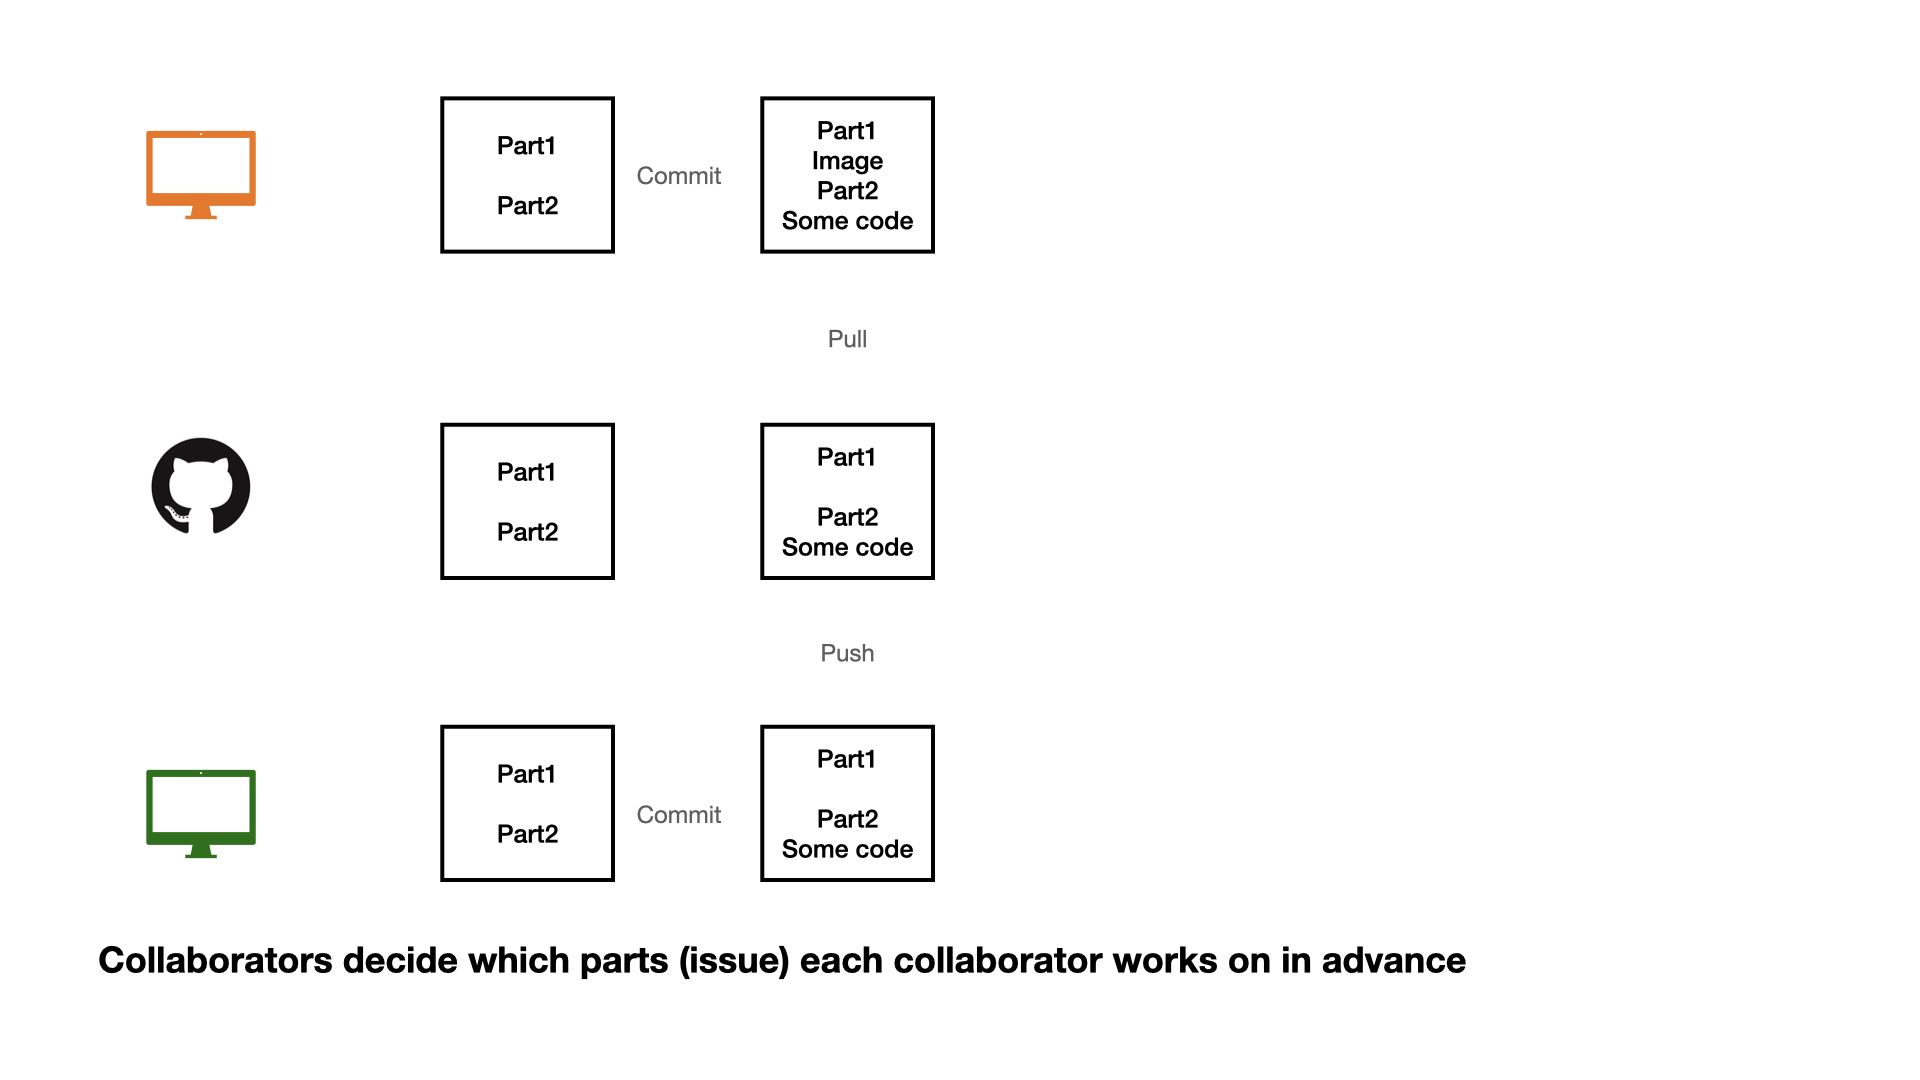
Making changes one collaborator at a time works, but it is not an efficient workflow: everyone has to wait for everyone else.
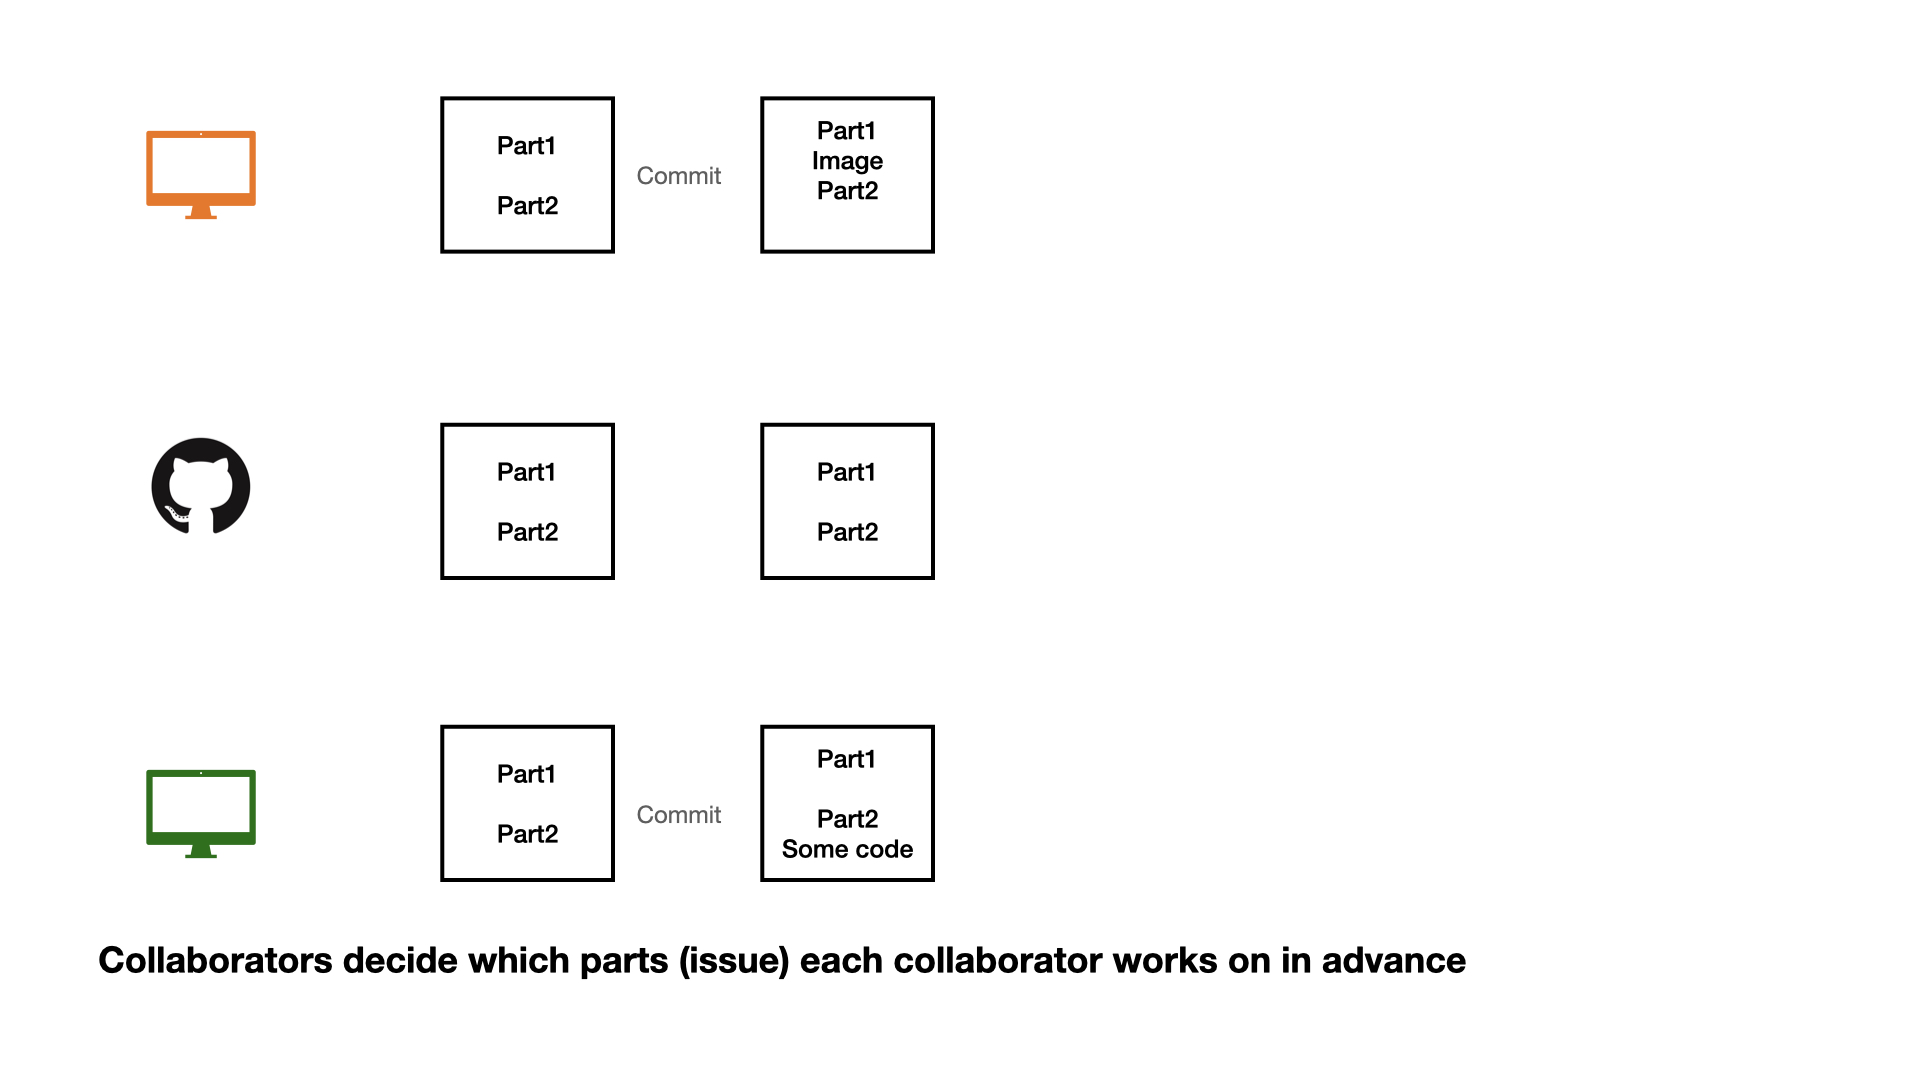
Instead, collaborators can work at the same time.
Collaboration on GitHub
Collaboration on GitHub
Collaboration on GitHub
Collaboration on GitHub
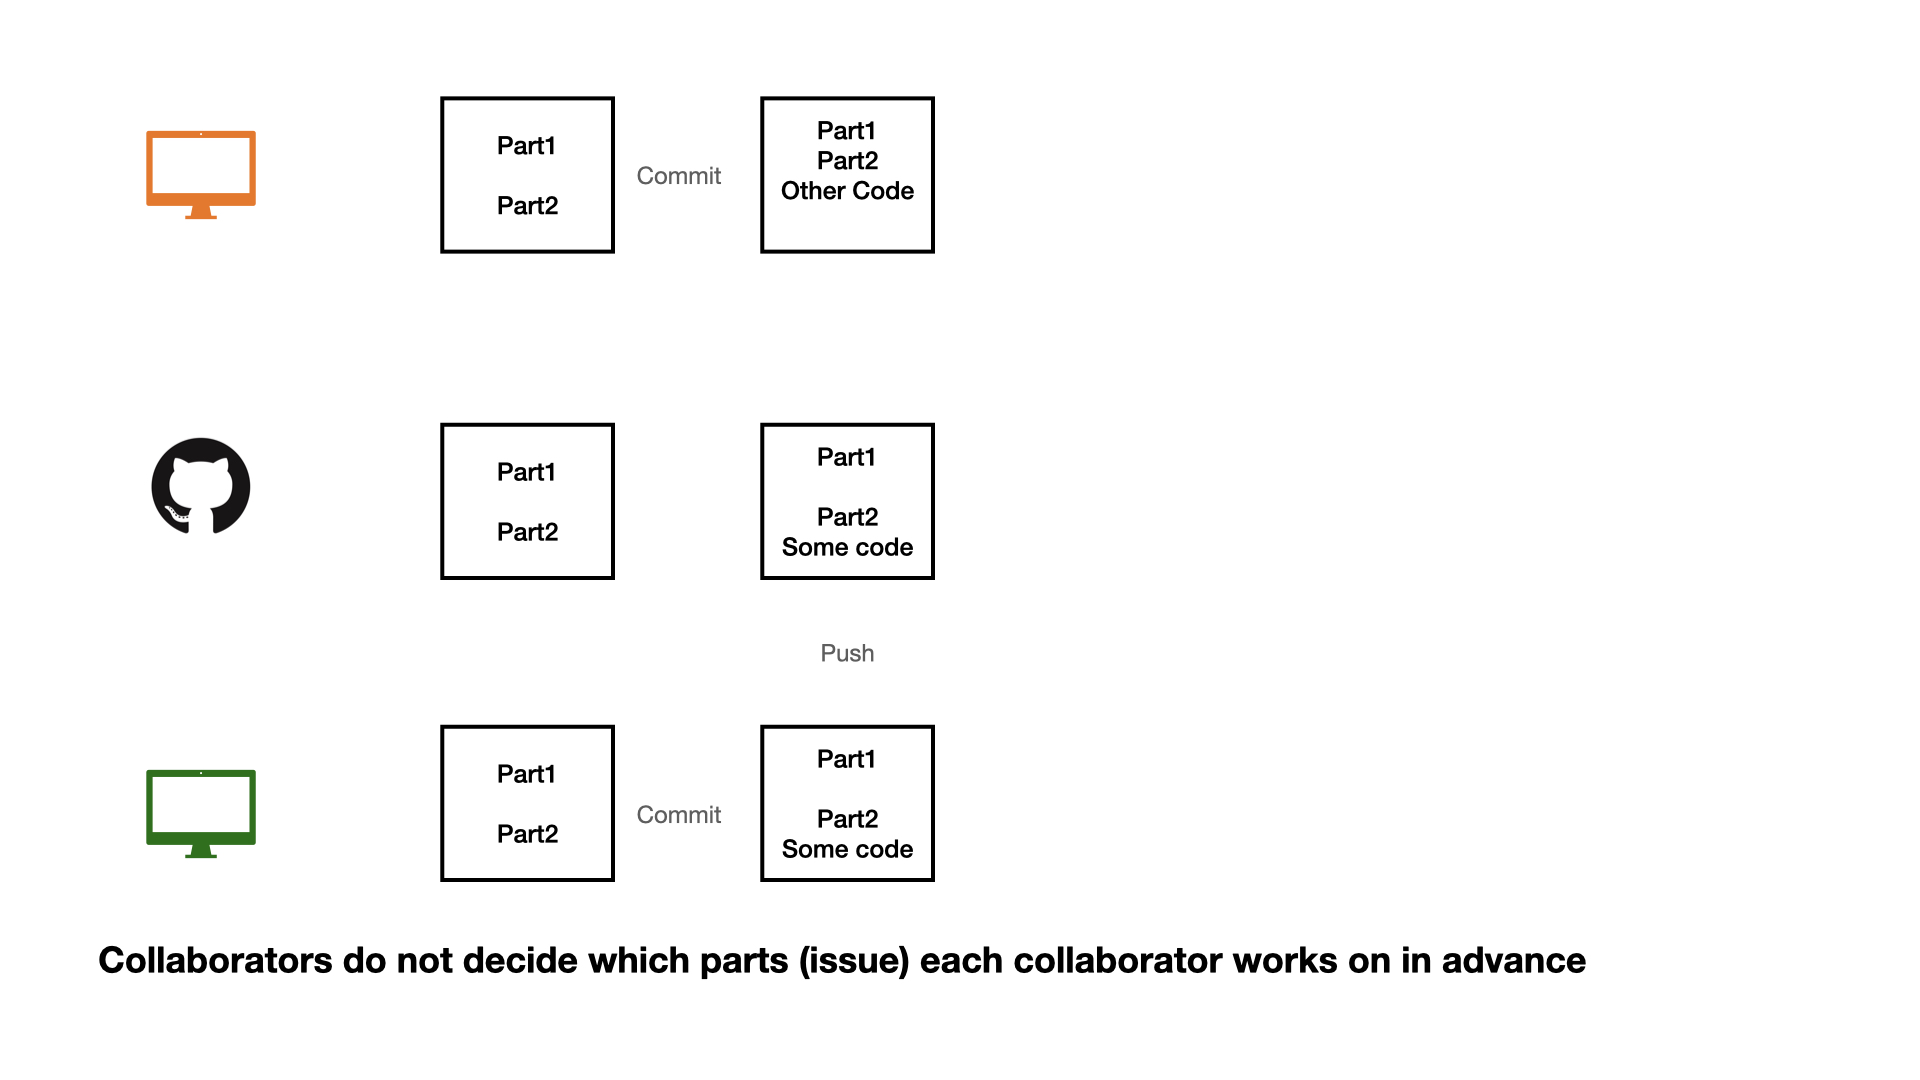
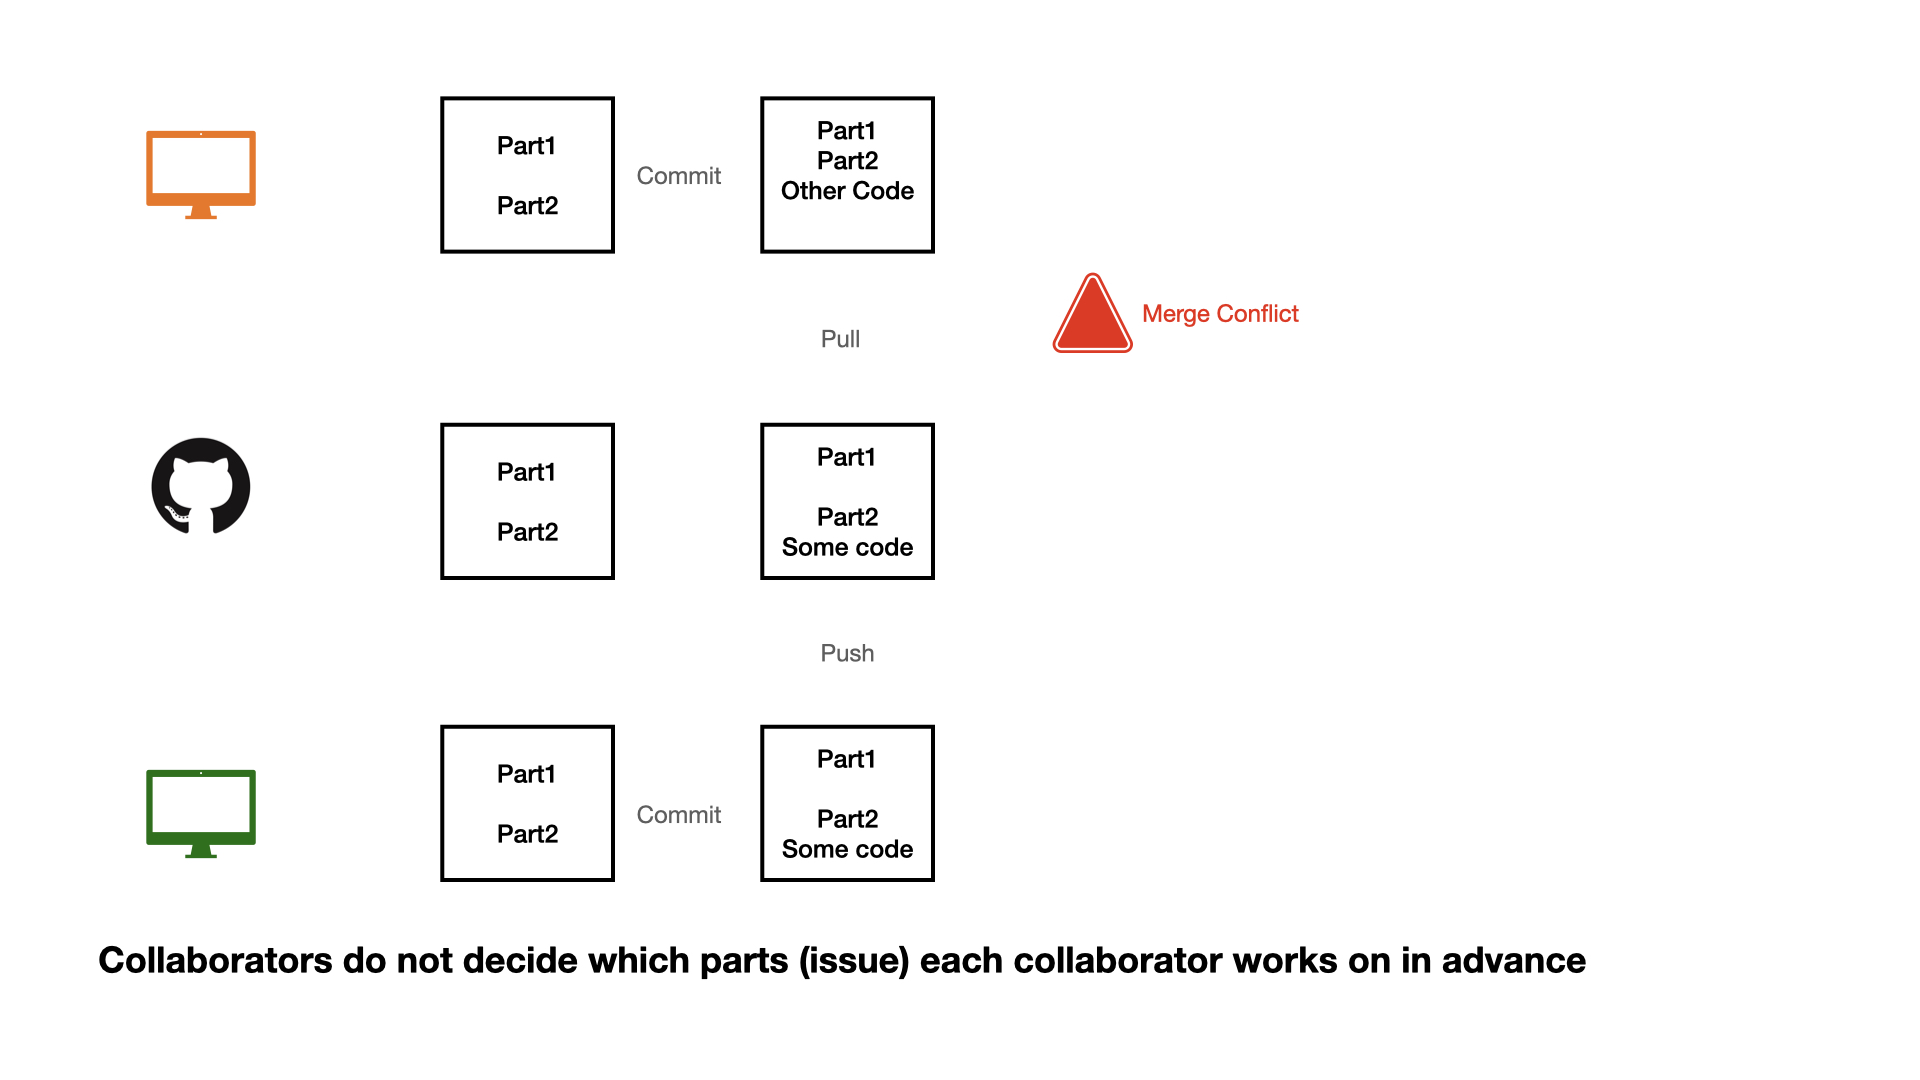
When collaborators work at the same time, follow this order:
1 - commit
2 - pull (very important)
3 - push
Collaboration on GitHub
Collaboration on GitHub
Collaboration on GitHub
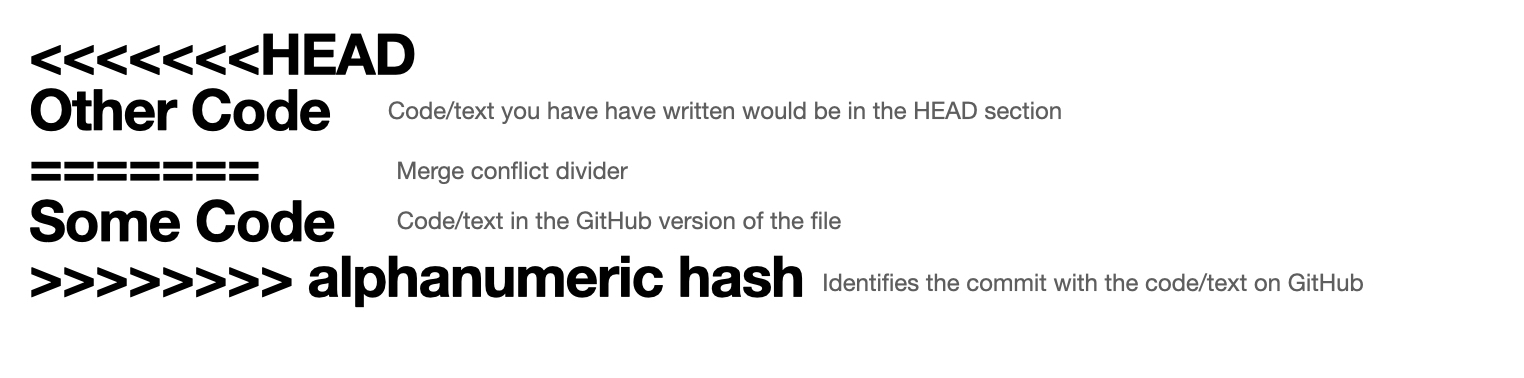
Resolving a merge conflict
Open the file with the conflict.
Decide what to keep: your version, your teammate’s version, or a combination of the two.
Delete the conflict markers (<<<<<<<, =======, >>>>>>>).
Commit and push.
The best way to deal with merge conflicts is to avoid them. Agree in advance on who is editing which file or section at a given time, and always pull before you start working.
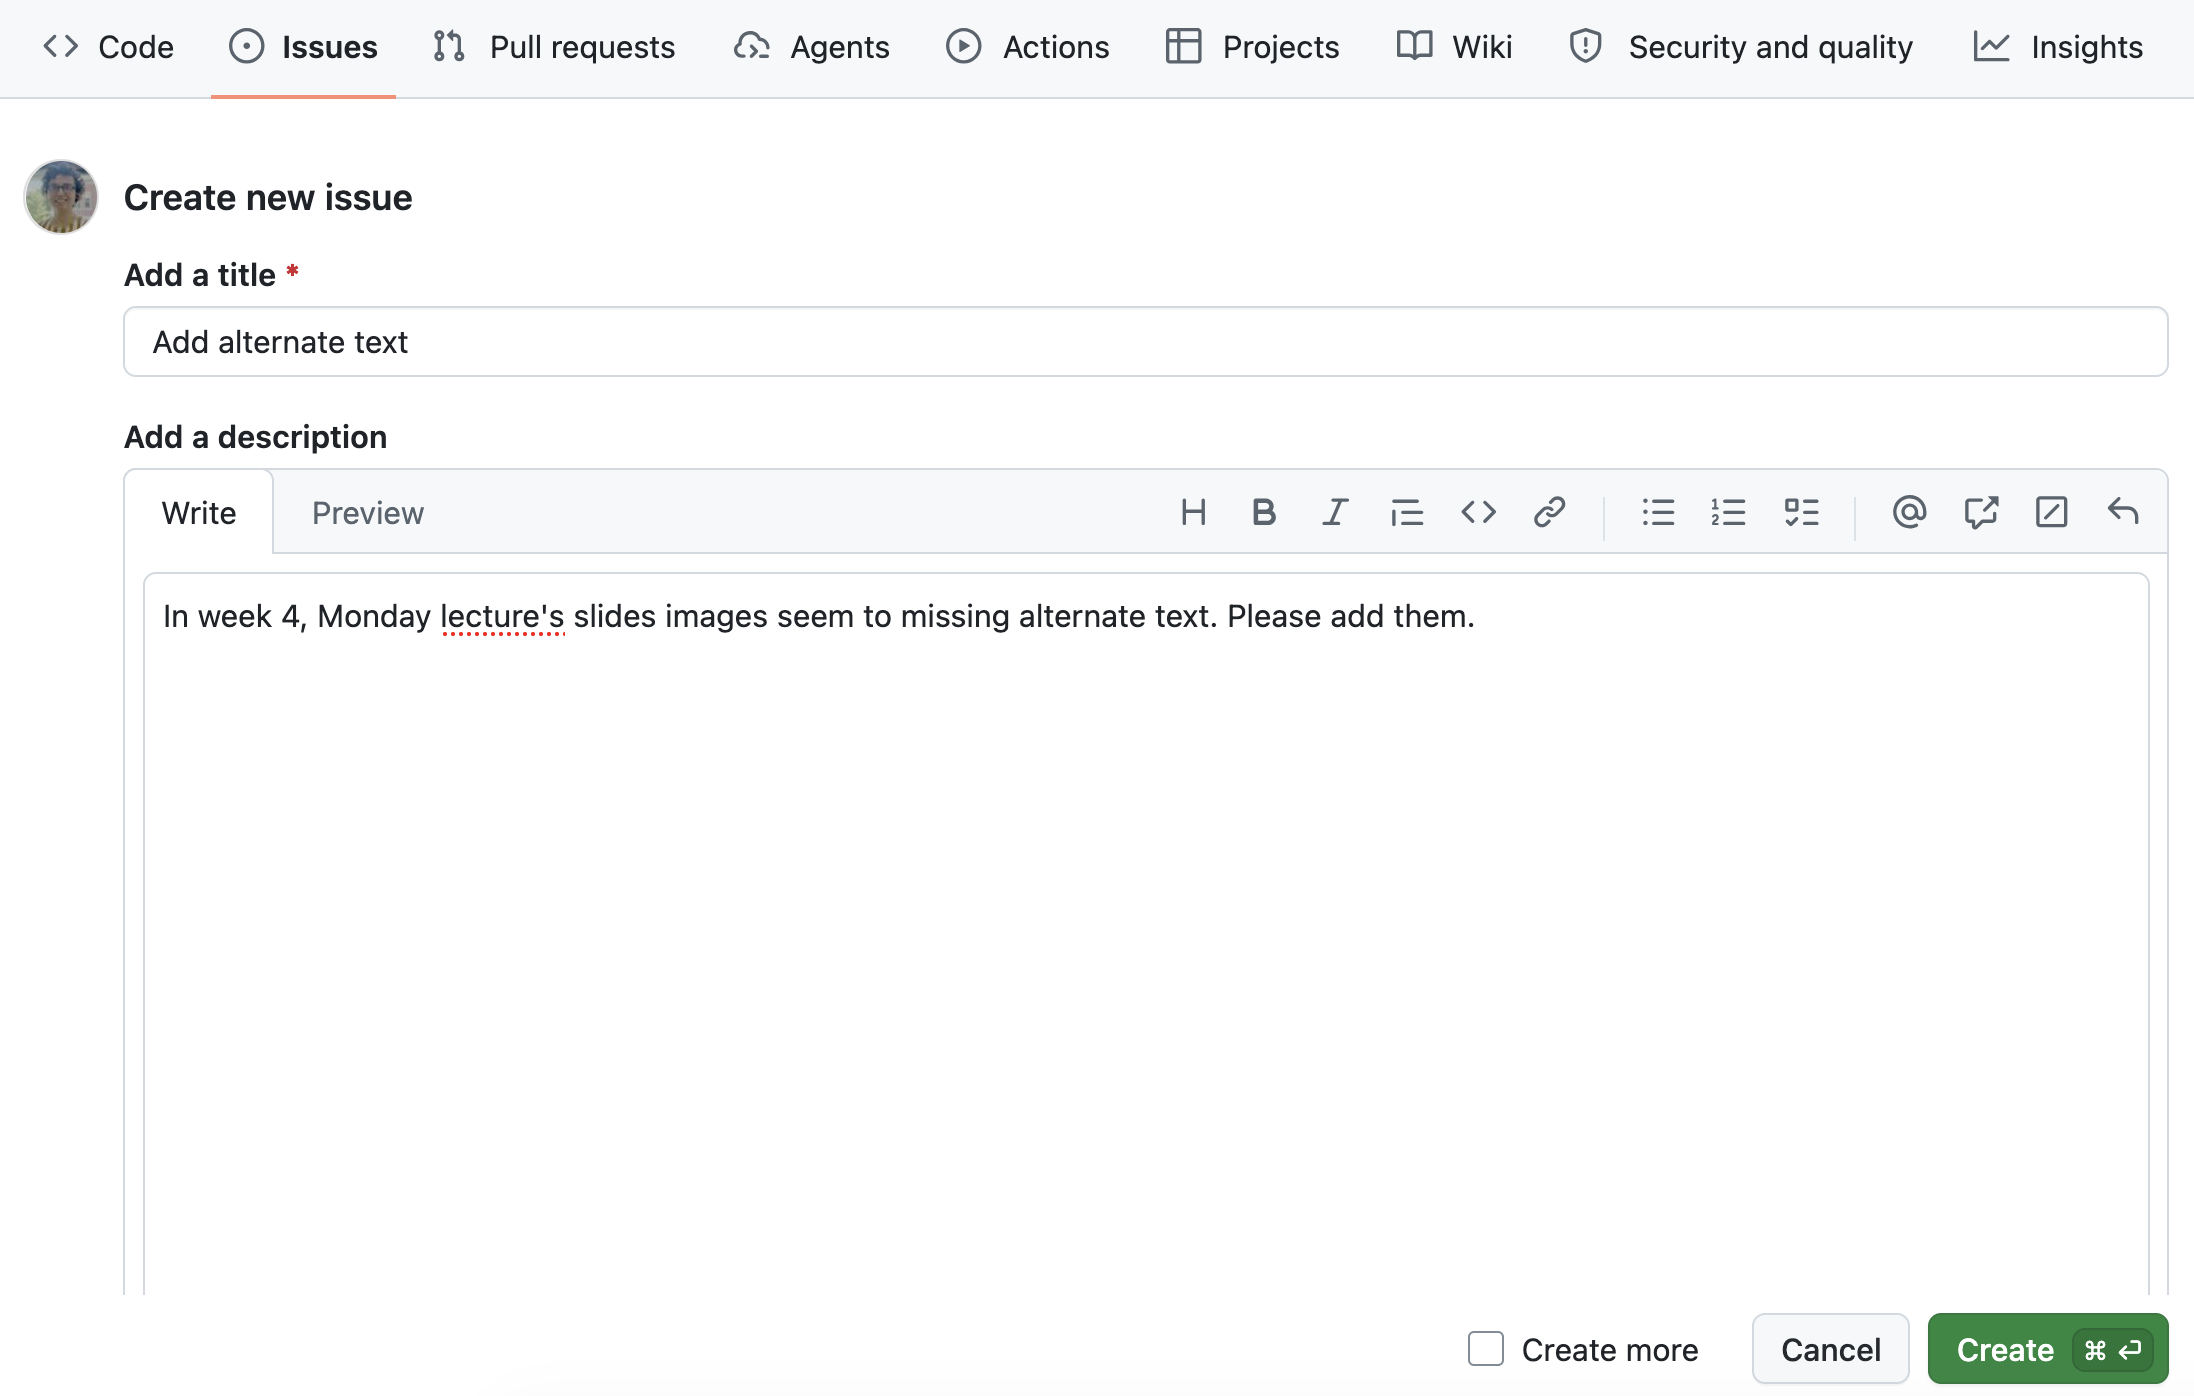
Opening an issue
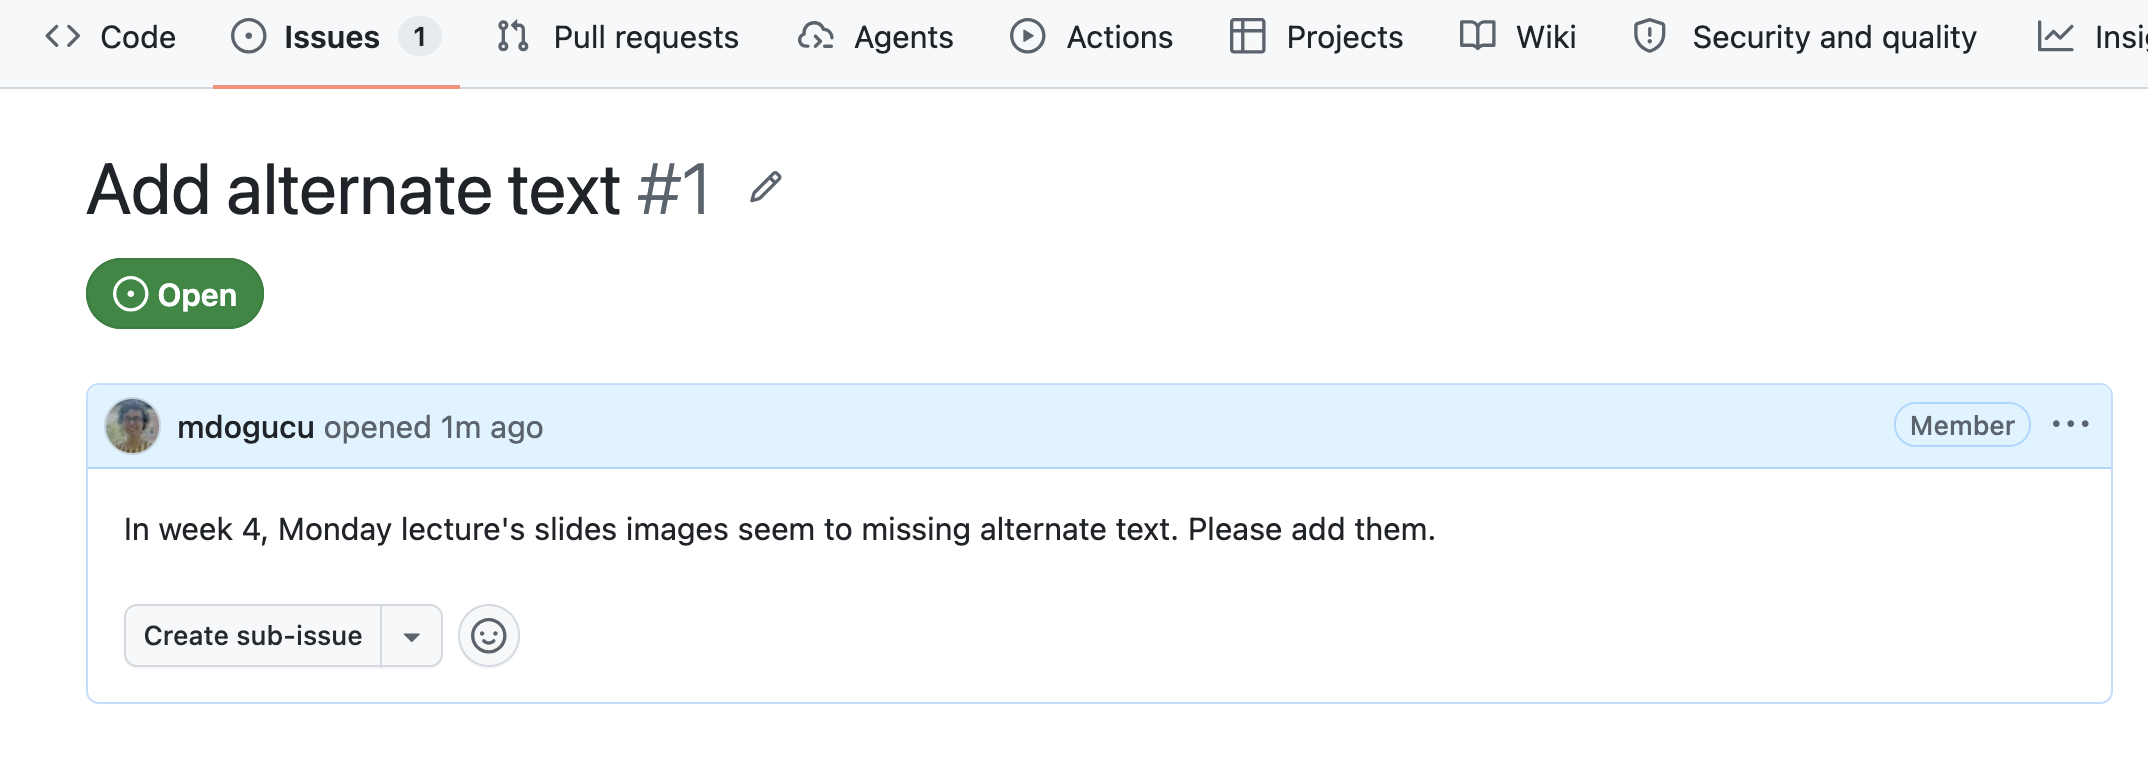
We can create an issue to keep track of mistakes to fix, ideas to discuss with teammates, or to-do tasks. You can assign issues to yourself or your teammates.
Closing an issue
If you are working on an issue, it makes sense to refer to the issue number in your commit message (e.g. “add first draft of alternate texts for #1”). If your commit resolves the issue then you can use keywords such as “fixes #1” or “closes #1” to close the issue. Issues can also be manually closed.
.gitignore
A .gitignore file contains the list of files that Git has been explicitly told to ignore.
For instance, README.html or .DS_Store can be git ignored.
You may consider git ignoring confidential files (e.g., some data sets) so that they are not pushed to GitHub by mistake.
.gitignore
For instance, a weather.csv data file in the data folder can be added to the .gitignore file as data/weather.csv.
Files of a certain type (e.g., all .log files) can also be ignored with a pattern such as *.log. See gitignore patterns.
What to git ignore in your project
.DS_Store
*.pdf
*.tex
.DS_Store: macOS creates this hidden file in every folder to remember how Finder displays the folder. It has nothing to do with your project, and every teammate’s Mac would keep changing it.
*.pdf: the rendered paper can always be recreated by rendering paper.qmd. PDFs are binary files, so Git cannot merge them, and two teammates rendering the paper would get a merge conflict every time.
*.tex: an intermediate LaTeX file that can be created while rendering to PDF. It can also be recreated from paper.qmd.
You can of course git ignore more files.
Git ignoring large data sets
GitHub does not accept files larger than 100 MB (and warns you about files larger than 50 MB). If your raw data file is too large, git ignore it:
data/raw/my-large-data.csv
Then your teammates (and course assistants) cannot get the file from GitHub. So data/README.md should include enough instructions to download it: the exact URL, the steps to download it (e.g., which options to select), the file name, the date you downloaded it, and where to save it (data/raw/).
One sentence per line
Git tracks changes line by line. If a whole paragraph is on one line, changing one word changes the whole line, and two teammates editing different sentences of the same paragraph get a merge conflict.
In .qmd files, start each sentence on a new line. A single line break does not show up in the rendered document. Markdown starts a new paragraph only after a blank line.
One sentence per line
Sleep is related to many aspects of health.In this paper, we investigate how the number of hours adults sleep is related to the number of days they report poor mental health.This sentence starts a new paragraph because of the blank line above it.
Renders as:
Sleep is related to many aspects of health.
In this paper, we investigate how the number of hours adults sleep is related to the number of days they report poor mental health.

This sentence starts a new paragraph because of the blank line above it.
Session Information
Package versions change over time. To reproduce the results of an analysis, we need to know under what technical conditions the analysis was conducted. So it is good practice to save session information.
Error in `count()`:
! Must group by variables found in `.data`.
✖ Column `continentt` is not found.
Without error: true, the render would stop at this chunk. In your paper, fix errors instead of using error: true.
Your turn
Which options would you use in your paper for a chunk that
loads packages and reads in your data?
makes a ggplot?
contains code you tried but no longer want to run, and you want to keep it in the .qmd file for your teammates to see?
Tables and Figures
Example
gapminder |>filter(year ==2007) |>slice_max(lifeExp, n =5) |>select(country, continent, lifeExp)
# A tibble: 5 × 3
  country          continent lifeExp
  <fct>            <fct>       <dbl>
1 Japan            Asia         82.6
2 Hong Kong, China Asia         82.2
3 Iceland          Europe       81.8
4 Switzerland      Europe       81.7
5 Australia        Oceania      81.2
Making tables
```{r}#| echo: false#| label: tbl-top-lifeexp#| tbl-cap: The five countries with the highest life expectancy in 2007.gapminder |>filter(year ==2007) |>slice_max(lifeExp, n =5) |>select(country, continent, lifeExp) |> knitr::kable(col.names =c("Country", "Continent", "Life expectancy (years)"),digits =1 )```
The label of a table must start with tbl-.
Use meaningful column names. Do not paste raw R output such as a printed tibble.
Making tables
Table 1: The five countries with the highest life expectancy in 2007.
Country
Continent
Life expectancy (years)
Japan
Asia
82.6
Hong Kong, China
Asia
82.2
Iceland
Europe
81.8
Switzerland
Europe
81.7
Australia
Oceania
81.2
Adding a ggplot
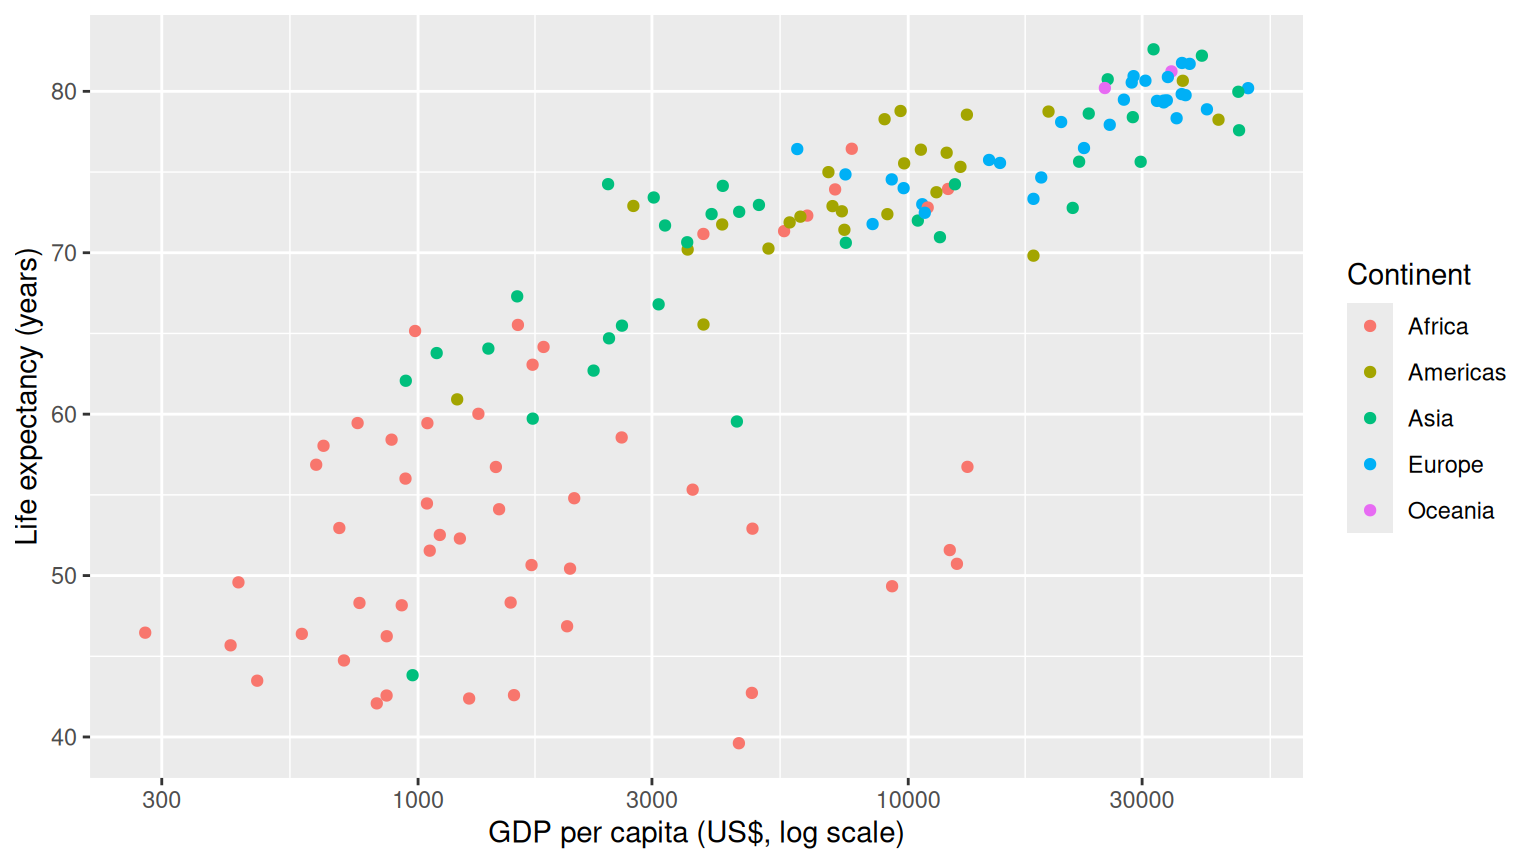
```{r}#| echo: false#| label: fig-lifeexp-gdp#| fig-cap: Life expectancy and GDP per capita of countries in 2007.#| fig-alt: A scatterplot of life expectancy versus GDP per capita ...gapminder |>filter(year ==2007) |>ggplot(aes(x = gdpPercap, y = lifeExp, color = continent)) +geom_point() +scale_x_log10() +labs(x ="GDP per capita (US$, log scale)",y ="Life expectancy (years)",color ="Continent")```
The label of a figure must start with fig-.
Use readable axis labels with units, not raw variable names.
Adding a ggplot
Figure 1: Life expectancy and GDP per capita of countries in 2007.
Adding an external figure
Save the image in your paper folder (e.g., paper/images/) and use knitr::include_graphics():
```{r}#| echo: false#| label: fig-my-figure#| fig-cap: Caption shown with the figure.#| fig-alt: A description of the figure for screen readers.#| out-width: 60%knitr::include_graphics(here::here("images/my-figure.png"))```
The path is relative to paper.qmd.
If you did not make the figure yourself, cite its source in the caption.
Cross-referencing figures and tables
Every figure and table should be discussed in the text. Refer to them by their labels:
As @fig-lifeexp-gdp shows, countries with higher GDP per capita tend to have higher life expectancy.@tbl-top-lifeexp lists the five countries with the highest life expectancy.
Renders as:
As Figure 1 shows, countries with higher GDP per capita tend to have higher life expectancy. Table 1 lists the five countries with the highest life expectancy.
Quarto numbers the figures and tables for you.
Citations
YAML: references
---title:"A detailed title of the paper"format: pdfbibliography: references.bib---
bibliography: references.bib tells Quarto where your references are. The file lives in the same folder as paper.qmd.
Citations: references.bib
paper/references.bib stores your references in BibTeX format:
@Manual{bryan2023,title = {gapminder: Data from Gapminder},author = {Jennifer Bryan},year = {2023},note = {R package version 1.0.0},url = {https://CRAN.R-project.org/package=gapminder},}
bryan2023 is the key you use to cite this reference.
For an R package, citation("gapminder") gives you the BibTeX entry (add your own key).
For articles, Google Scholar has a “Cite” button that gives you a BibTeX entry. Always check it against the actual publication.
Citations in the text
You write
It renders as
[@bryan2023]
(Bryan 2023)
@bryan2023
Bryan (2023)
[@bryan2023; @wickham2019]
(Bryan 2023; Wickham et al. 2019)
Quarto creates the reference list for you from the references you cite.
References and AI use statement
By default, the references go at the very end of the paper. To put your AI Use Statement after the references, place the references yourself:
# References::: {#refs}:::# AI Use StatementWe used ...
Rendering your paper
Render paper/paper.qmd often, not only right before the deadline.
Your paper should render from start to finish on a fresh copy of the repository, reading data from data/processed/.
If rendering to PDF fails because LaTeX is missing, install TinyTeX in the Console with install.packages("tinytex") and then tinytex::install_tinytex().