1sample(1:100, 3, replace = FALSE)- 1
- This allows us to sample 3 numbers from 1 to 100 without replacement, meaning a number can only be selected once.
[1] 7 12 62Every research project aims to answer a research question (or multiple questions).
Example
Do Harvard students who exercise regularly have higher GPA?
We will use this research question throughout the examples in the lecture.
Each research question aims to examine a population.
Example
Population for this research question is Harvard students.
Data are collected to answer research questions. There are different methods to collect data. For instance, data can be collected
When collecting data from human and animal research subjects we need to consider ethics.
In universities, rights of the human and animal research subjects are protected by the Institutional Review Board (IRB) of each university. If interested (highly recommended) you can read about Harvard’s IRB, the Committee on the Use of Human Subjects.
Consider that we design a survey with the following questions to study the research question.
Do you exercise at least once every week?
What is your GPA?
A population is a collection of elements which the research question aims to study. However it is often costly and sometimes impossible to study the whole population. Often a subset of the population is selected to be studied. Sample is the subset of the population that is studied. The goal is to have a sample that is representative of the population so that the findings of the study can generalize to the population.
Since it would be almost impossible to give the survey to ALL Harvard students, we can give it to a sample of students.
There are different sampling methods to consider.
When data are collected from every element of the population, it is called a census.
Example
Even a census can miss people. Some groups, such as young children and people without a stable address, are harder to count and may be undercounted.
| Measure | Sample Statistic | Population Parameter |
|---|---|---|
| Mean | x̄ | μ |
| Standard Deviation | s | σ |
| Variance | s2 | σ2 |
| Proportion | p | π |
Starting next class, we will learn how to use sample data to estimate the population parameter.
Convenience sampling occurs when a specific sample is selected because the sample is easy to access.
Example
This could introduce (sampling) bias and the findings may not generalize to the population. It is possible that those in front of the library
When simple random sampling technique is used any element of the population has an equal chance of being selected to the sample.
Example
The researcher can
Assume that the 100 selected students respond.
Population: All Harvard students
Sample: 100 students who have responded
1sample(1:100, 3, replace = FALSE)[1] 7 12 62To generalize:
This code will take a random sample of size \(n\) from the population consisting of the numbers in the interval \([1, N]\)
Side note: This is not truly random but that’s beyond the scope of this class. Here is a fun (short) reading about it. Philosophers also discuss if true randomness exists or not.
Even when simple random sampling is used, if participants are unwilling to participate in studies then the results can have nonresponse bias.
Example
It is unlikely that 100 students will respond. Assume that 86 respond.
It is possible that those 14 who did not respond
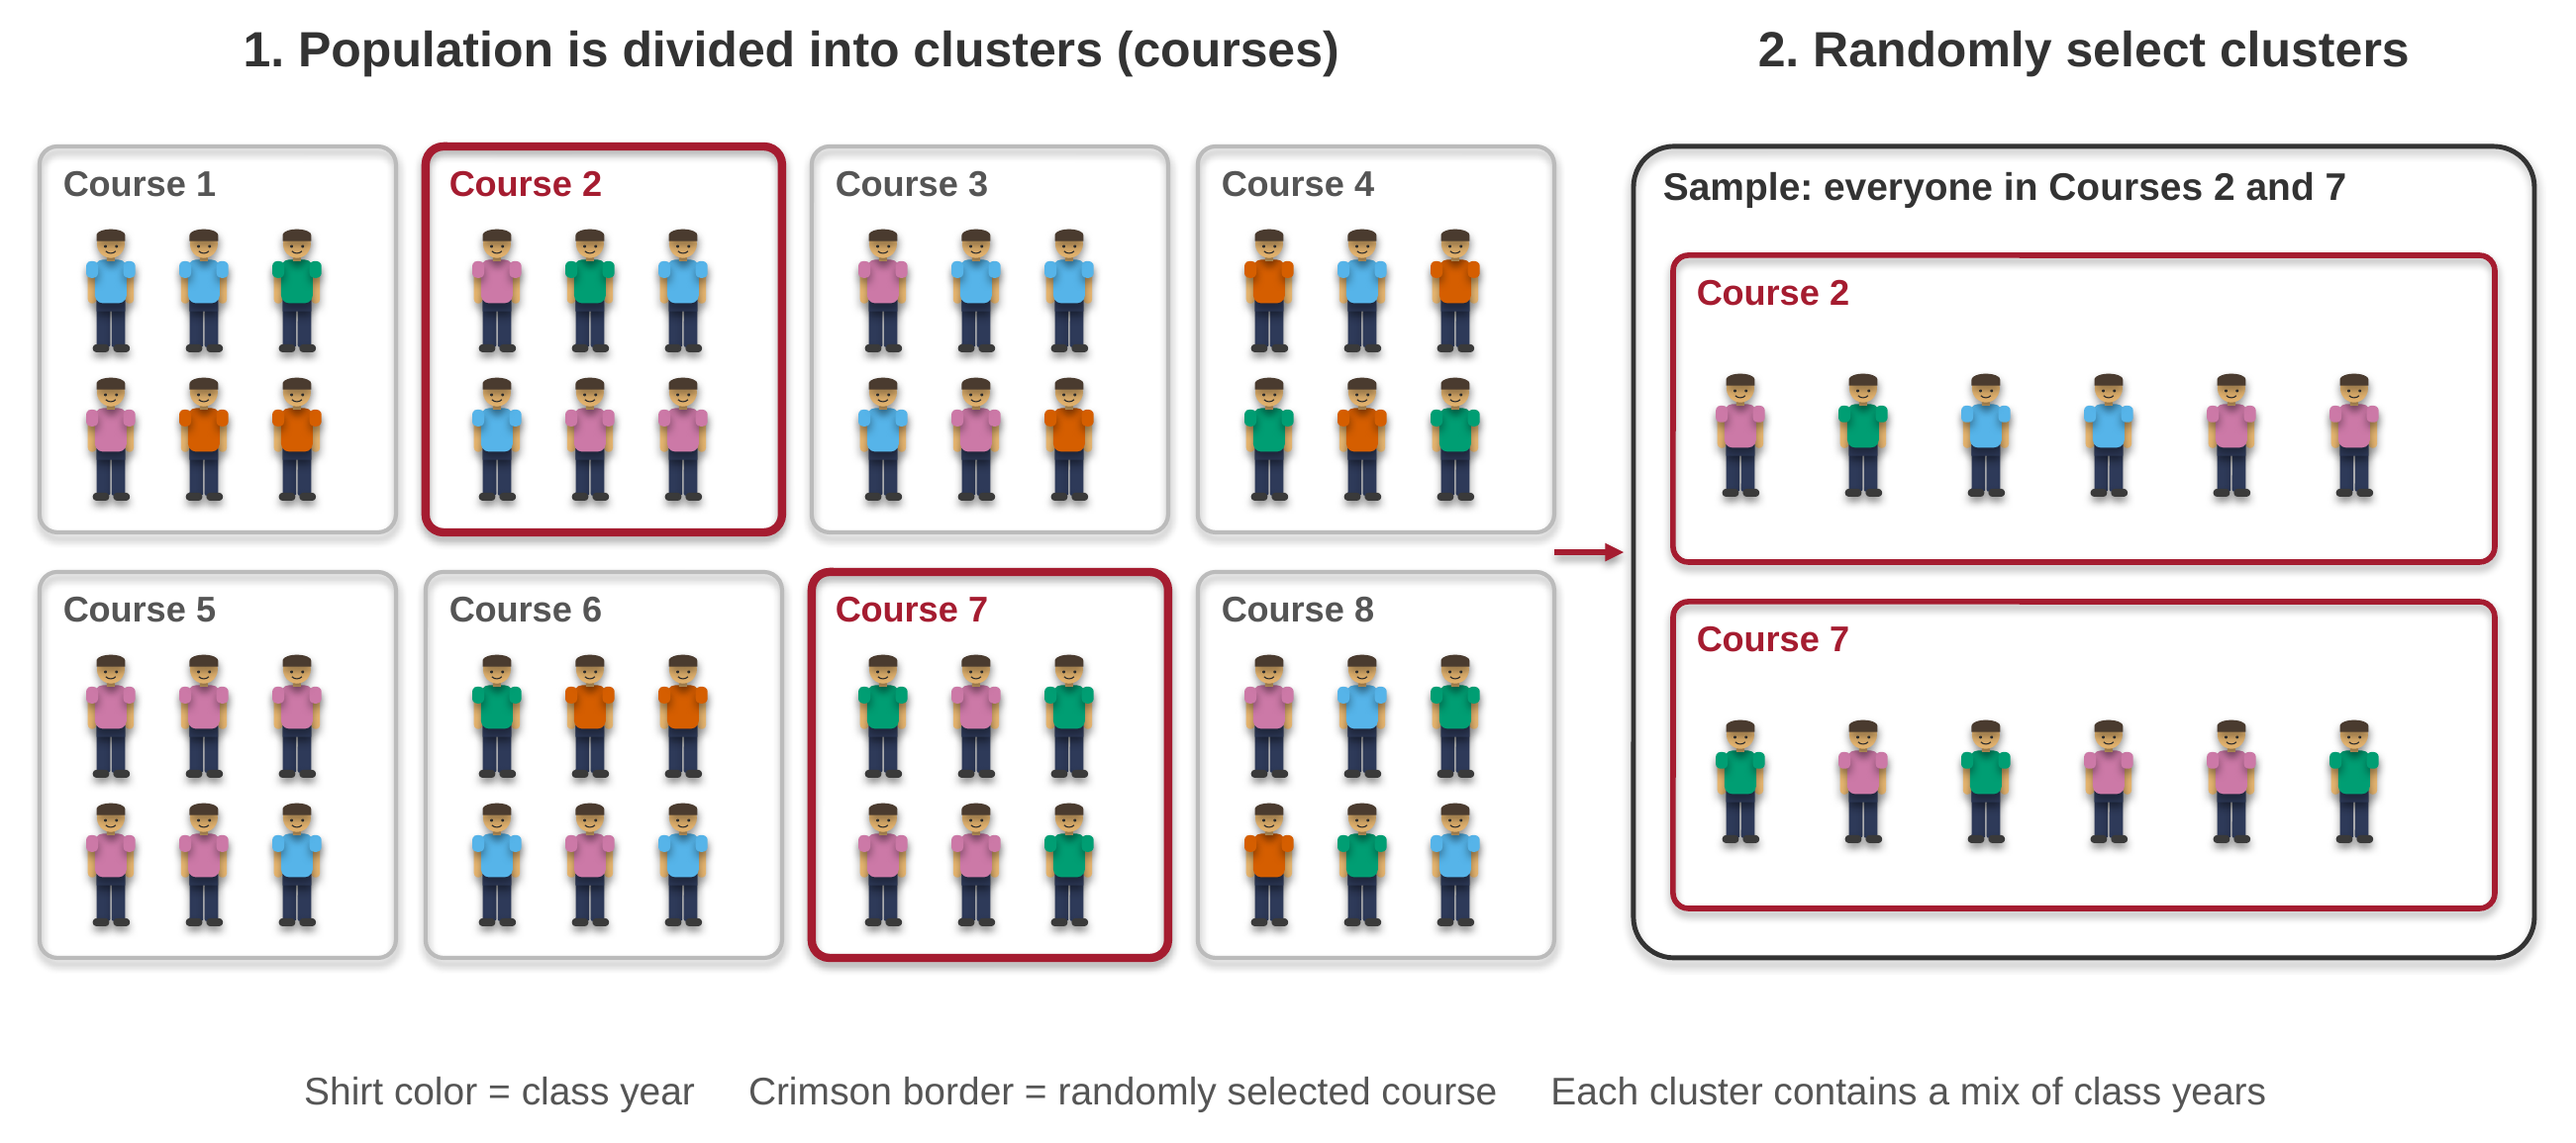
In cluster sampling the population is divided into groups (i.e., clusters). The sample consists of all elements in randomly selected clusters.
Example
The researchers may get a list of courses taught at Harvard. They randomly select 10 courses. All the students in those 10 courses will be in the sample.
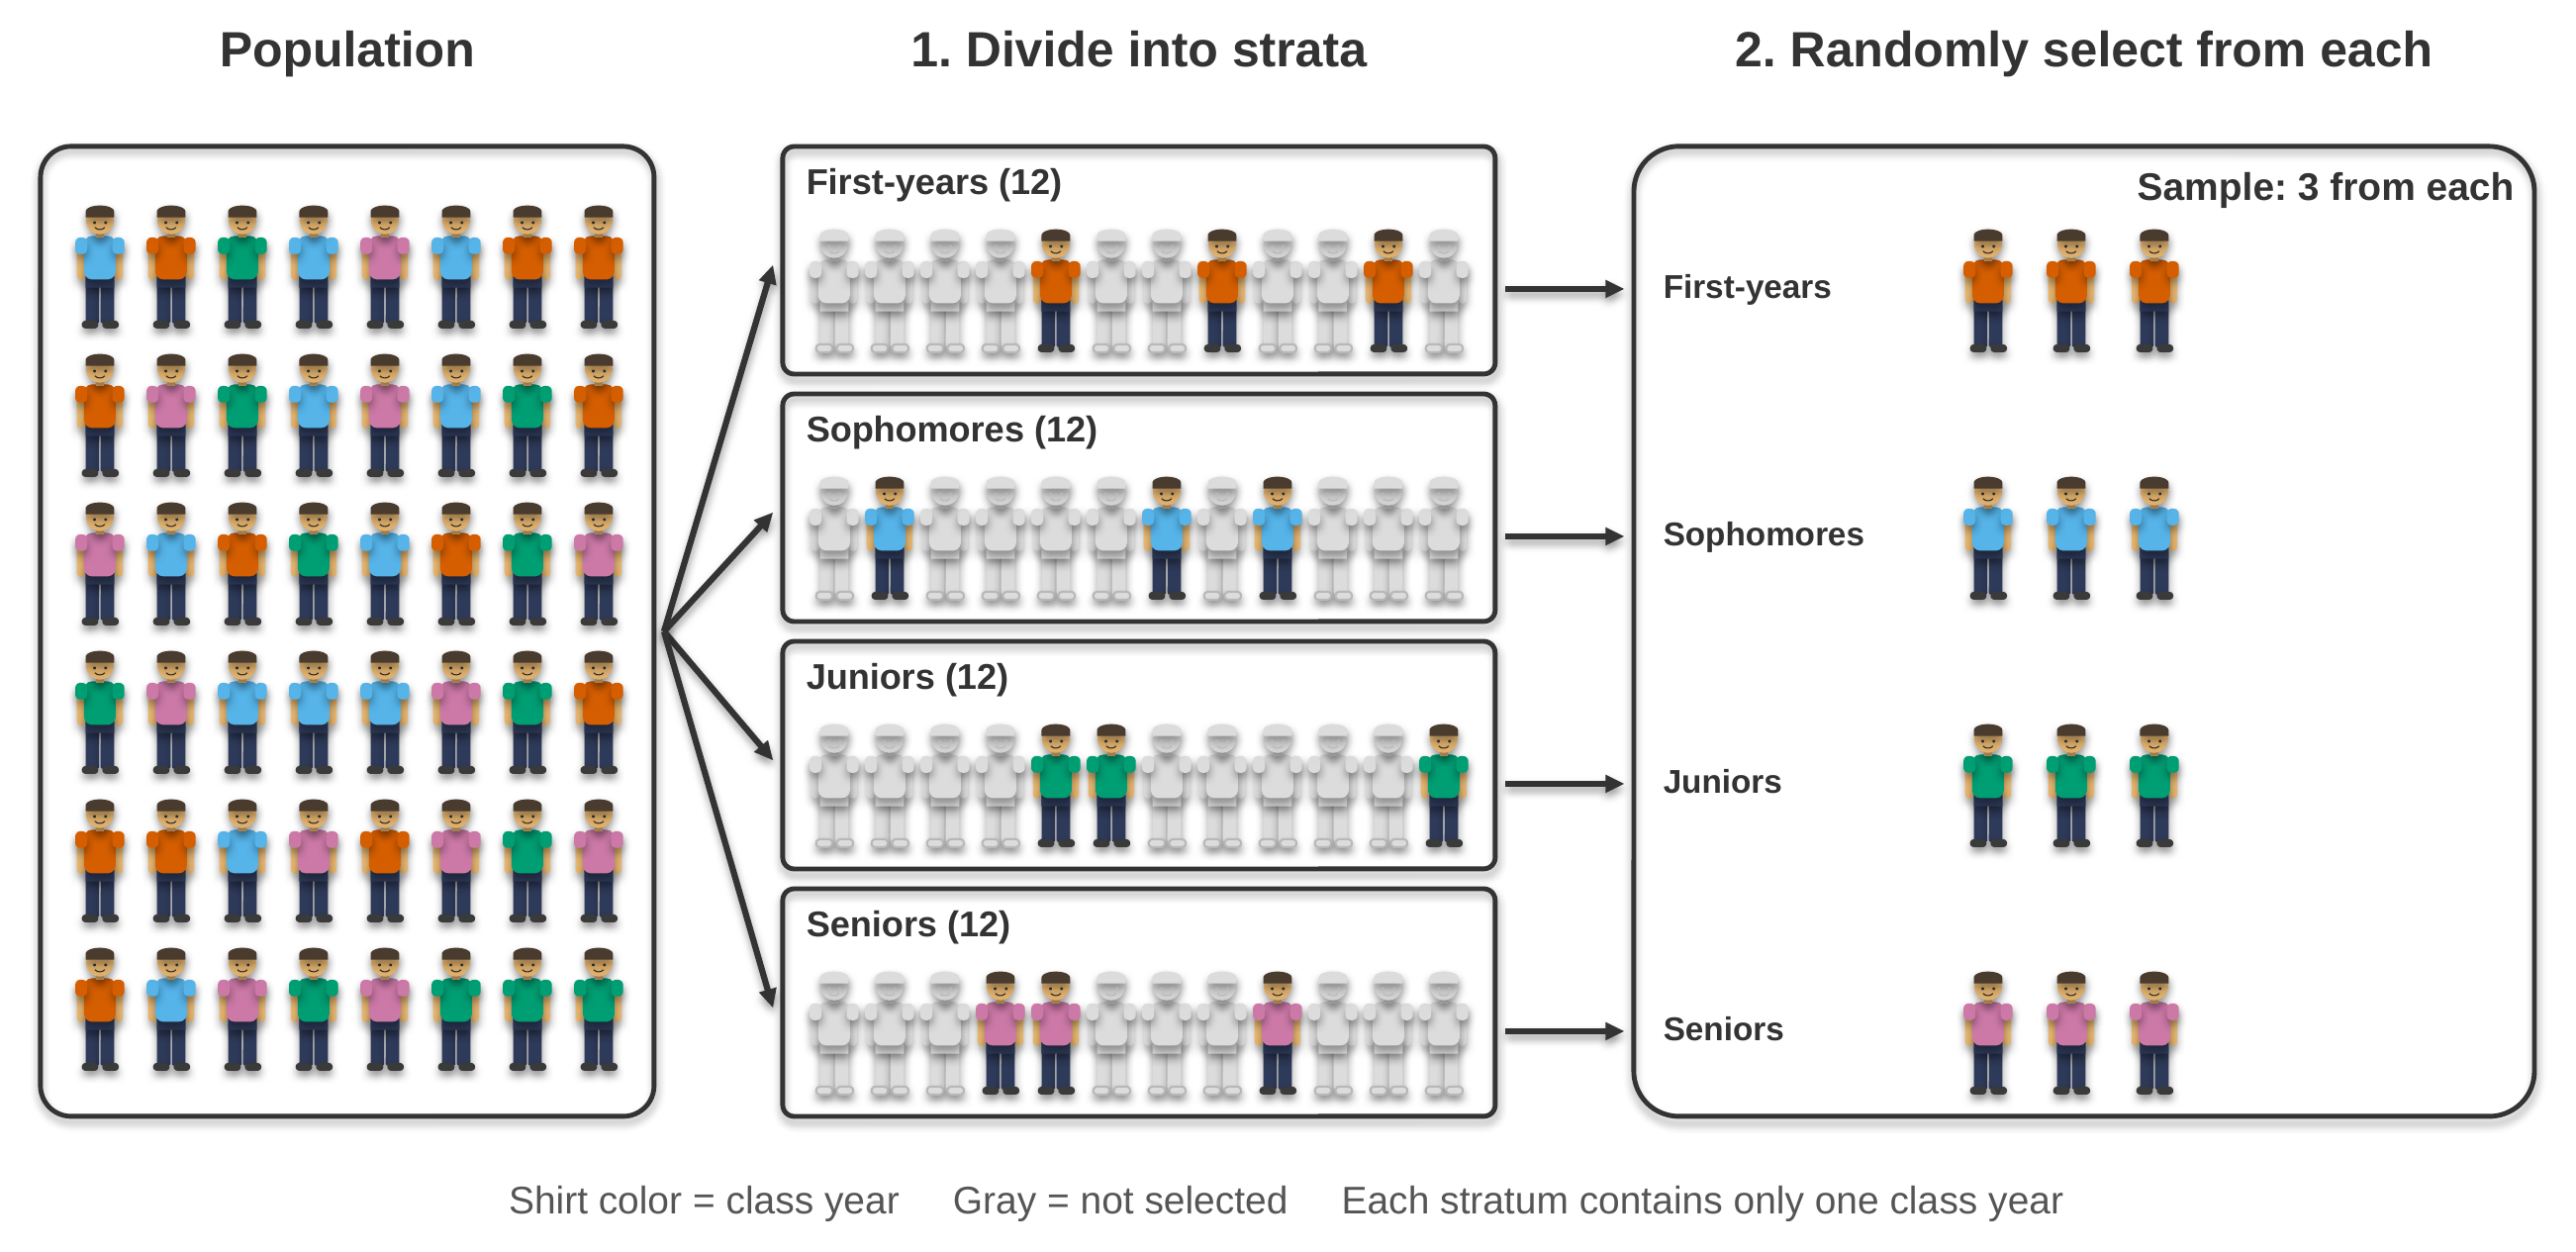
In stratified sampling the population is first divided into groups (i.e., strata) and then the sample is selected randomly within each stratum.
Example
The researchers suspect that exercising patterns might be different across different class years. Thus they want to make sure that the sample includes first-years, sophomores, juniors, and seniors. They get a list of students with class year information from the registrar. They then randomly select 25 first-years, 25 sophomores, 25 juniors, and 25 seniors.
Anecdotal evidence is an observation that is not systematic and haphazard.
Example
We might meet a junior who got an A in every Harvard course they have taken, and they say that they exercise regularly. Even though the data are factually correct (i.e., high GPA and regular exercise routine), this does not tell us whether exercising regularly is related to GPA for Harvard students in general.
Anecdotal evidence is not a scientific method to answer research questions. We need rigorously designed studies to make generalizations and/or to establish causal relationships.
In observational studies, researchers study the research question without exposing the cases (or subset of a sample) to any treatment or intervention. In observational studies causal relationships between variables cannot be established.
Example
Based on the survey, even if we observe that Harvard students who exercise regularly have higher GPA, we cannot conclude that exercising regularly increases GPA.
If two variables are related to each other in some way we would call them associated.
If two variables are not related to each other in any way we would call them independent.
When we examine the relationship between two variables, we often want to know if the relationship between them is causal. In other words, does one variable cause the other? For instance, is exercising the reason for higher GPA? We don’t know!
When we suspect that two variables have a causal relationship we can say
The explanatory variable (e.g. exercising) might causally affect the response variable (e.g. GPA).
Relationship between two variables does not imply one causes the other.
Explanatory variables are denoted by \(x\) and the response variable is denoted by \(y\). You can remember this from eXplanatory variable is \(x\). Exercising may eXplain high GPA.
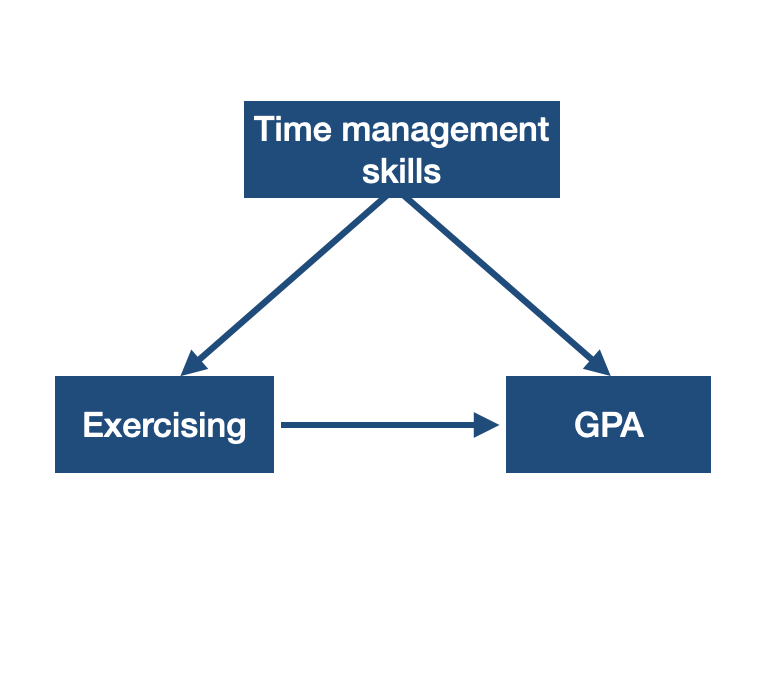
A confounding variable (e.g. time management skills) is associated with both the explanatory and the response variable.
In experiments, researchers assign cases to treatments/interventions.
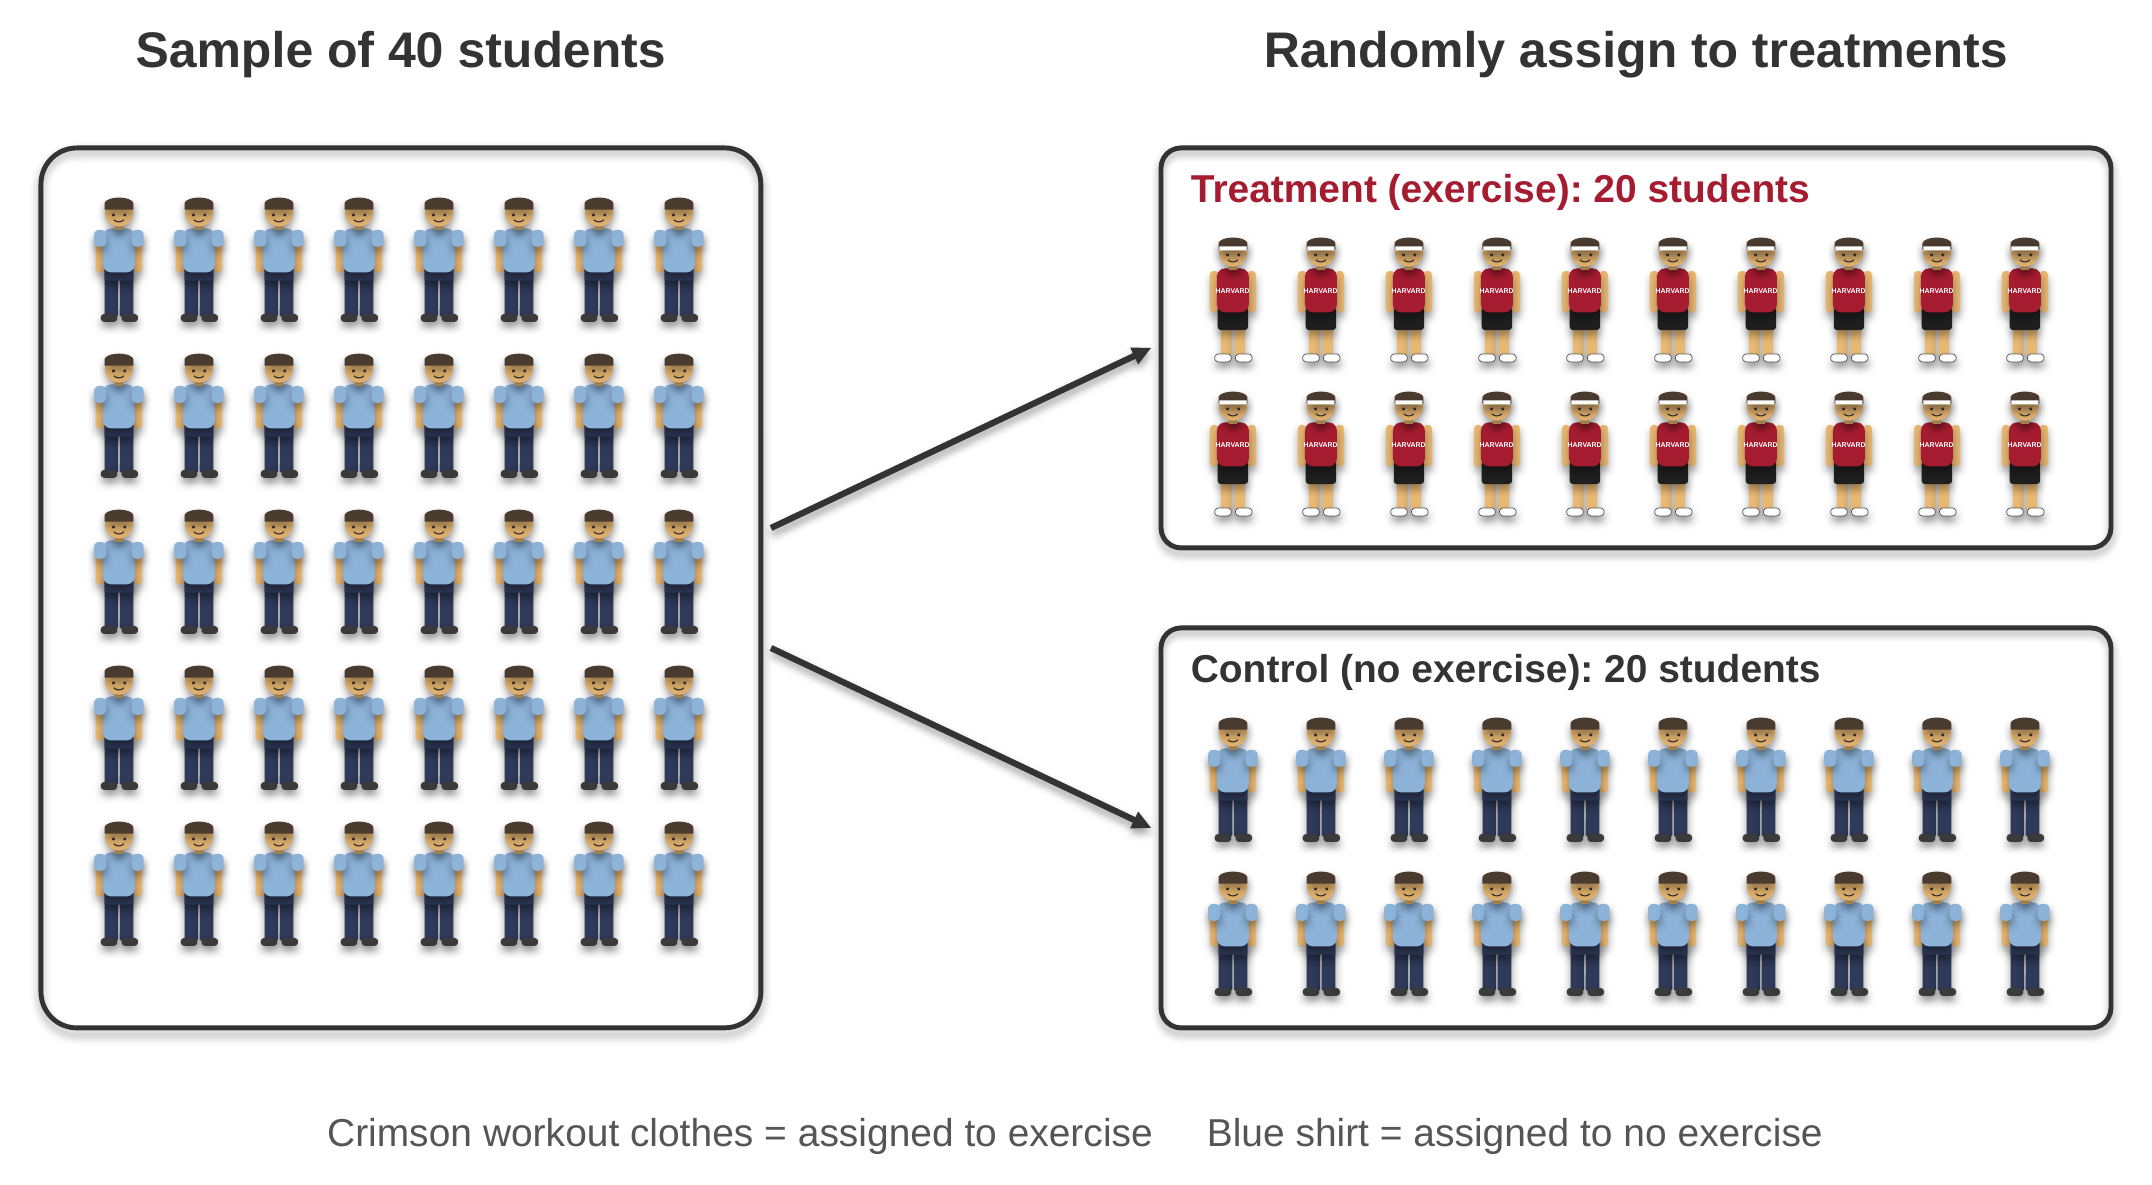
In randomized experiments, researchers randomly assign cases to treatments/interventions. In order to establish a causal link between variables, we need randomized experiments.
Example
Do Harvard students who exercise regularly have higher GPA?
Does exercising regularly increase GPA for Harvard students?
Random sampling and random assignment (i.e., random allocation) serve different purposes.
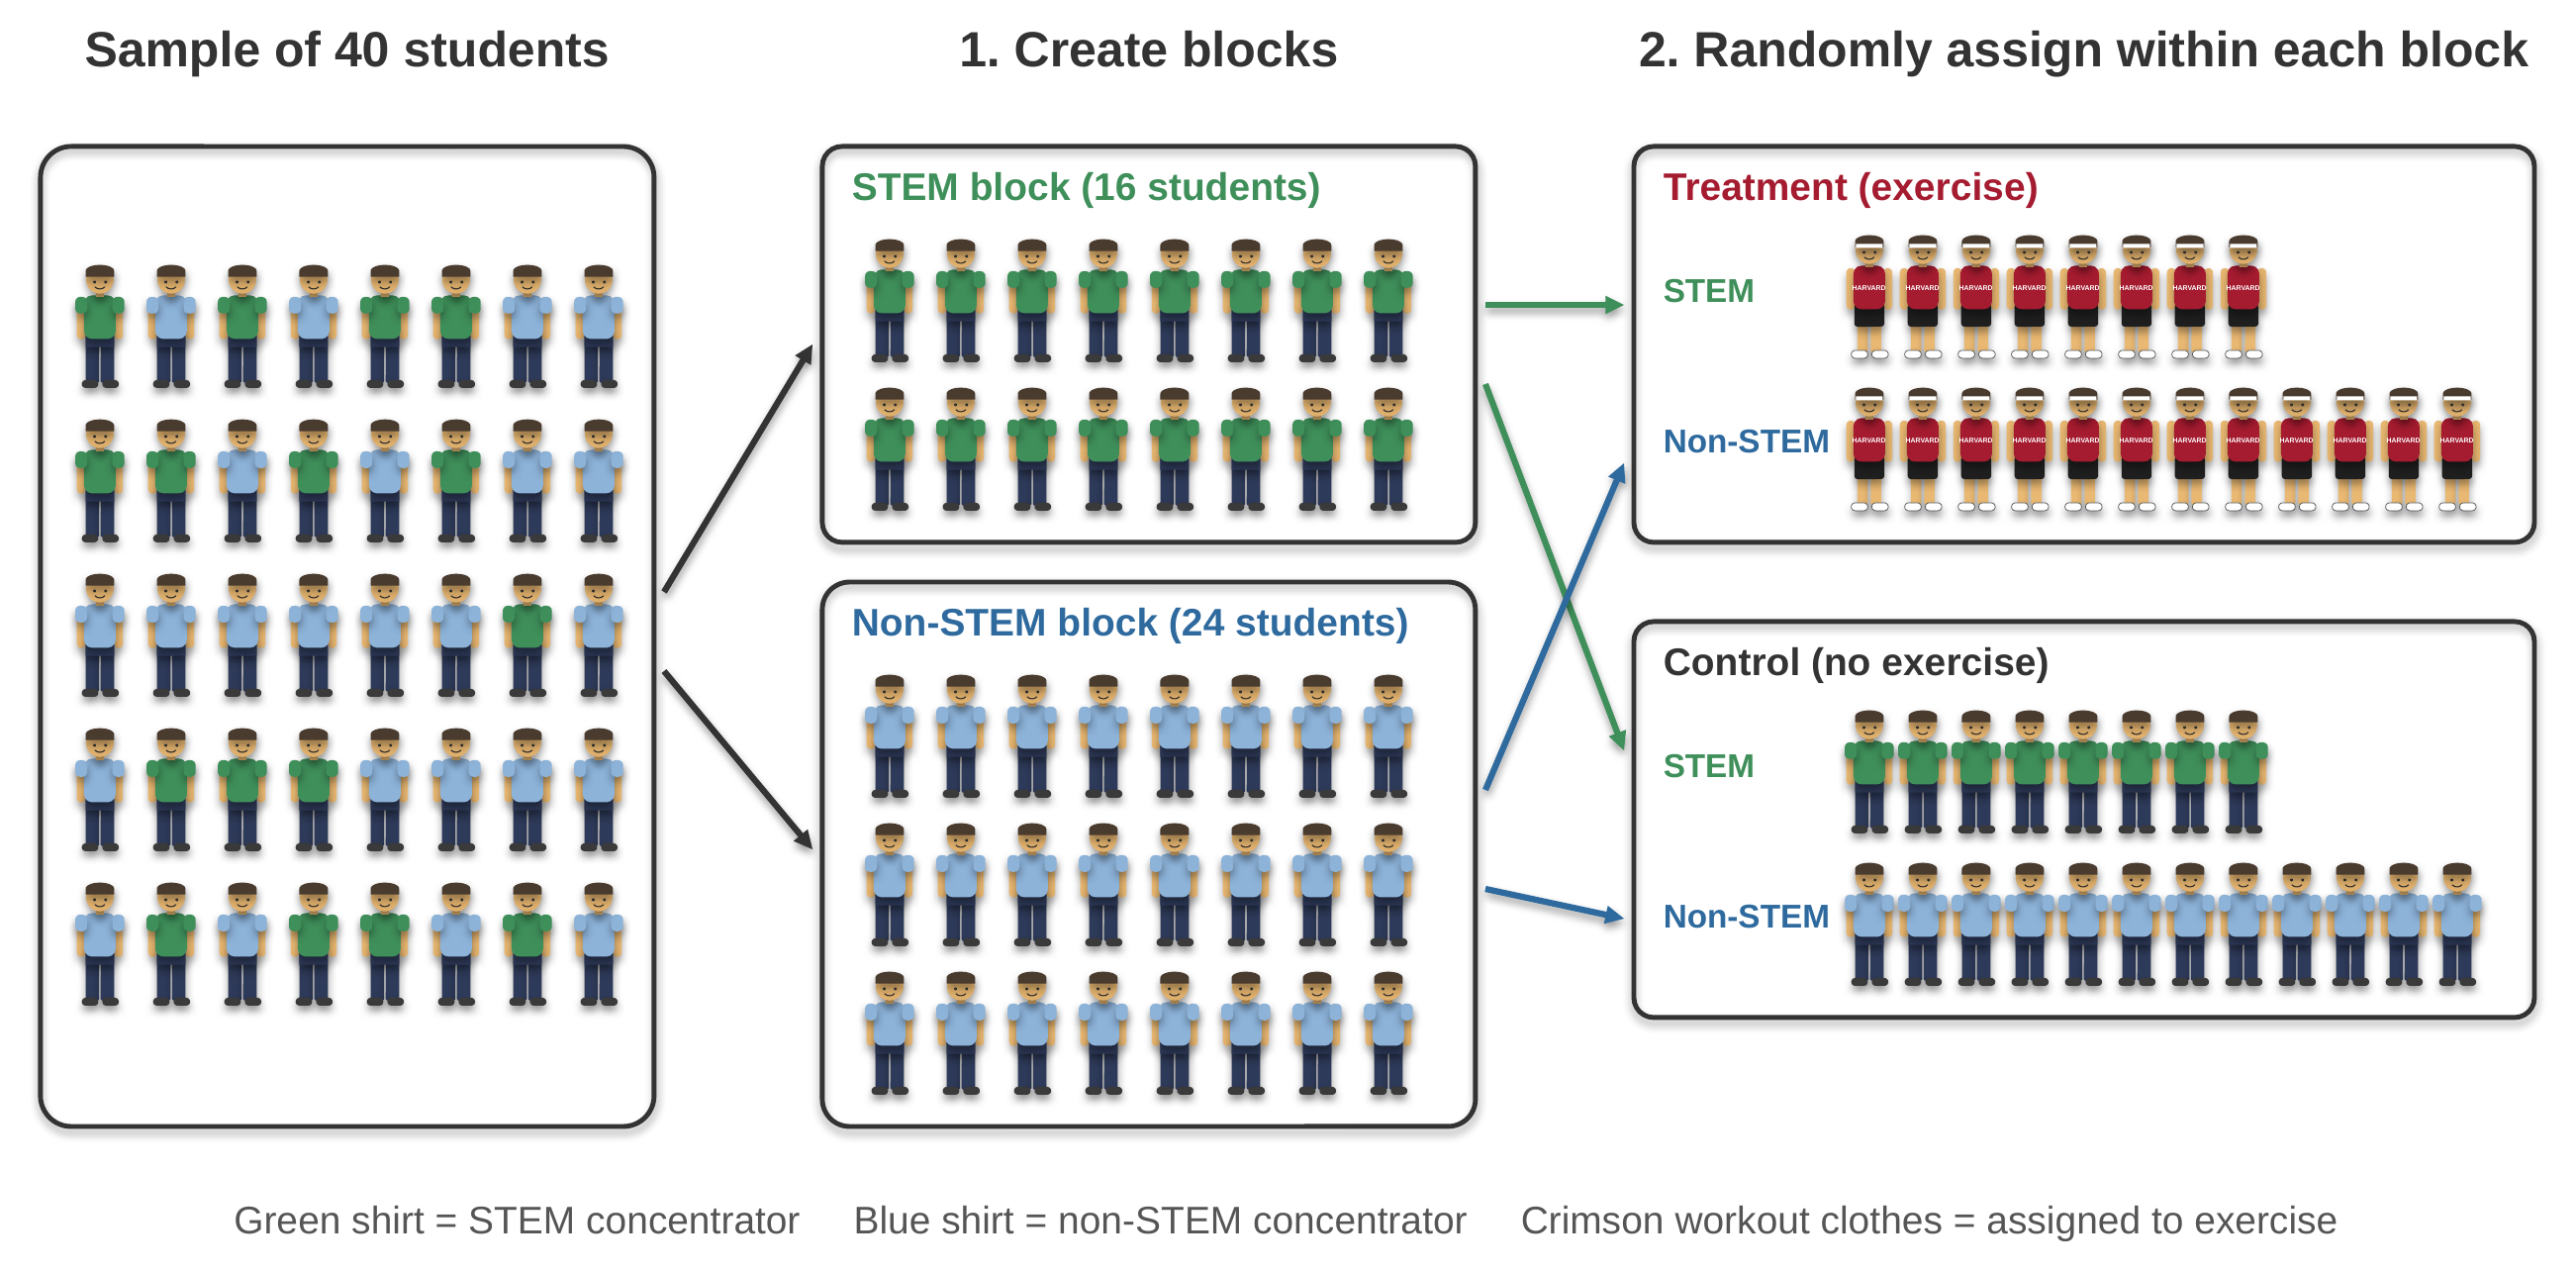
The researchers suspect that GPA may differ between students who concentrate in STEM fields and those in non-STEM fields, regardless of exercise.
If researchers suspect that an additional variable may influence the response variable, then they may use blocks:
This way both treatment groups have a similar mix of STEM and non-STEM students, so a difference in GPA cannot be explained by concentration.
Both start by splitting people into groups based on a variable. They differ in when the split happens and why.
| Feature | Stratified sampling | Blocking |
|---|---|---|
| Stage of the study | Choosing the sample from the population | Assigning the sample to treatments |
| Groups are called | strata | blocks |
| What is random | selection of cases within each stratum | assignment of cases to treatments within each block |
| Goal | sample represents each group → generalizability | treatment groups are comparable on the blocking variable → causal comparison |
| Example | Randomly select 25 first-years, 25 sophomores, 25 juniors, and 25 seniors to survey | Within STEM and within non-STEM students, randomly assign half to exercise |
Note
A study can use both: stratified sampling to choose who is in the study, and blocking to decide who gets the treatment.
Exercise
A professor wants to know whether taking notes by hand, rather than on a laptop, leads to higher exam scores. With your neighbor, design a randomized experiment. Specify:
A/B testing is a randomized experiment that compares two versions (A and B) of a single variable.
It is commonly used on measuring online activities such as revenue per user, click through rates for online ads, number of returning users.
Microsoft, Amazon, Booking.com, Facebook, and Google each run more than 10,000 online experiments a year.
You are probably part of several A/B tests right now: the thumbnail you see for a show, the price of a subscription offer, or the time a notification arrives may differ from what your friend sees.
That is why companies test instead of trusting their intuition.
Source: Kohavi & Thomke (2017). The Surprising Power of Online Experiments. Harvard Business Review.
| Component | Blog example |
|---|---|
| Population | visitors to the blog |
| Unit (what is randomized) | a user, so the same person always sees the same version |
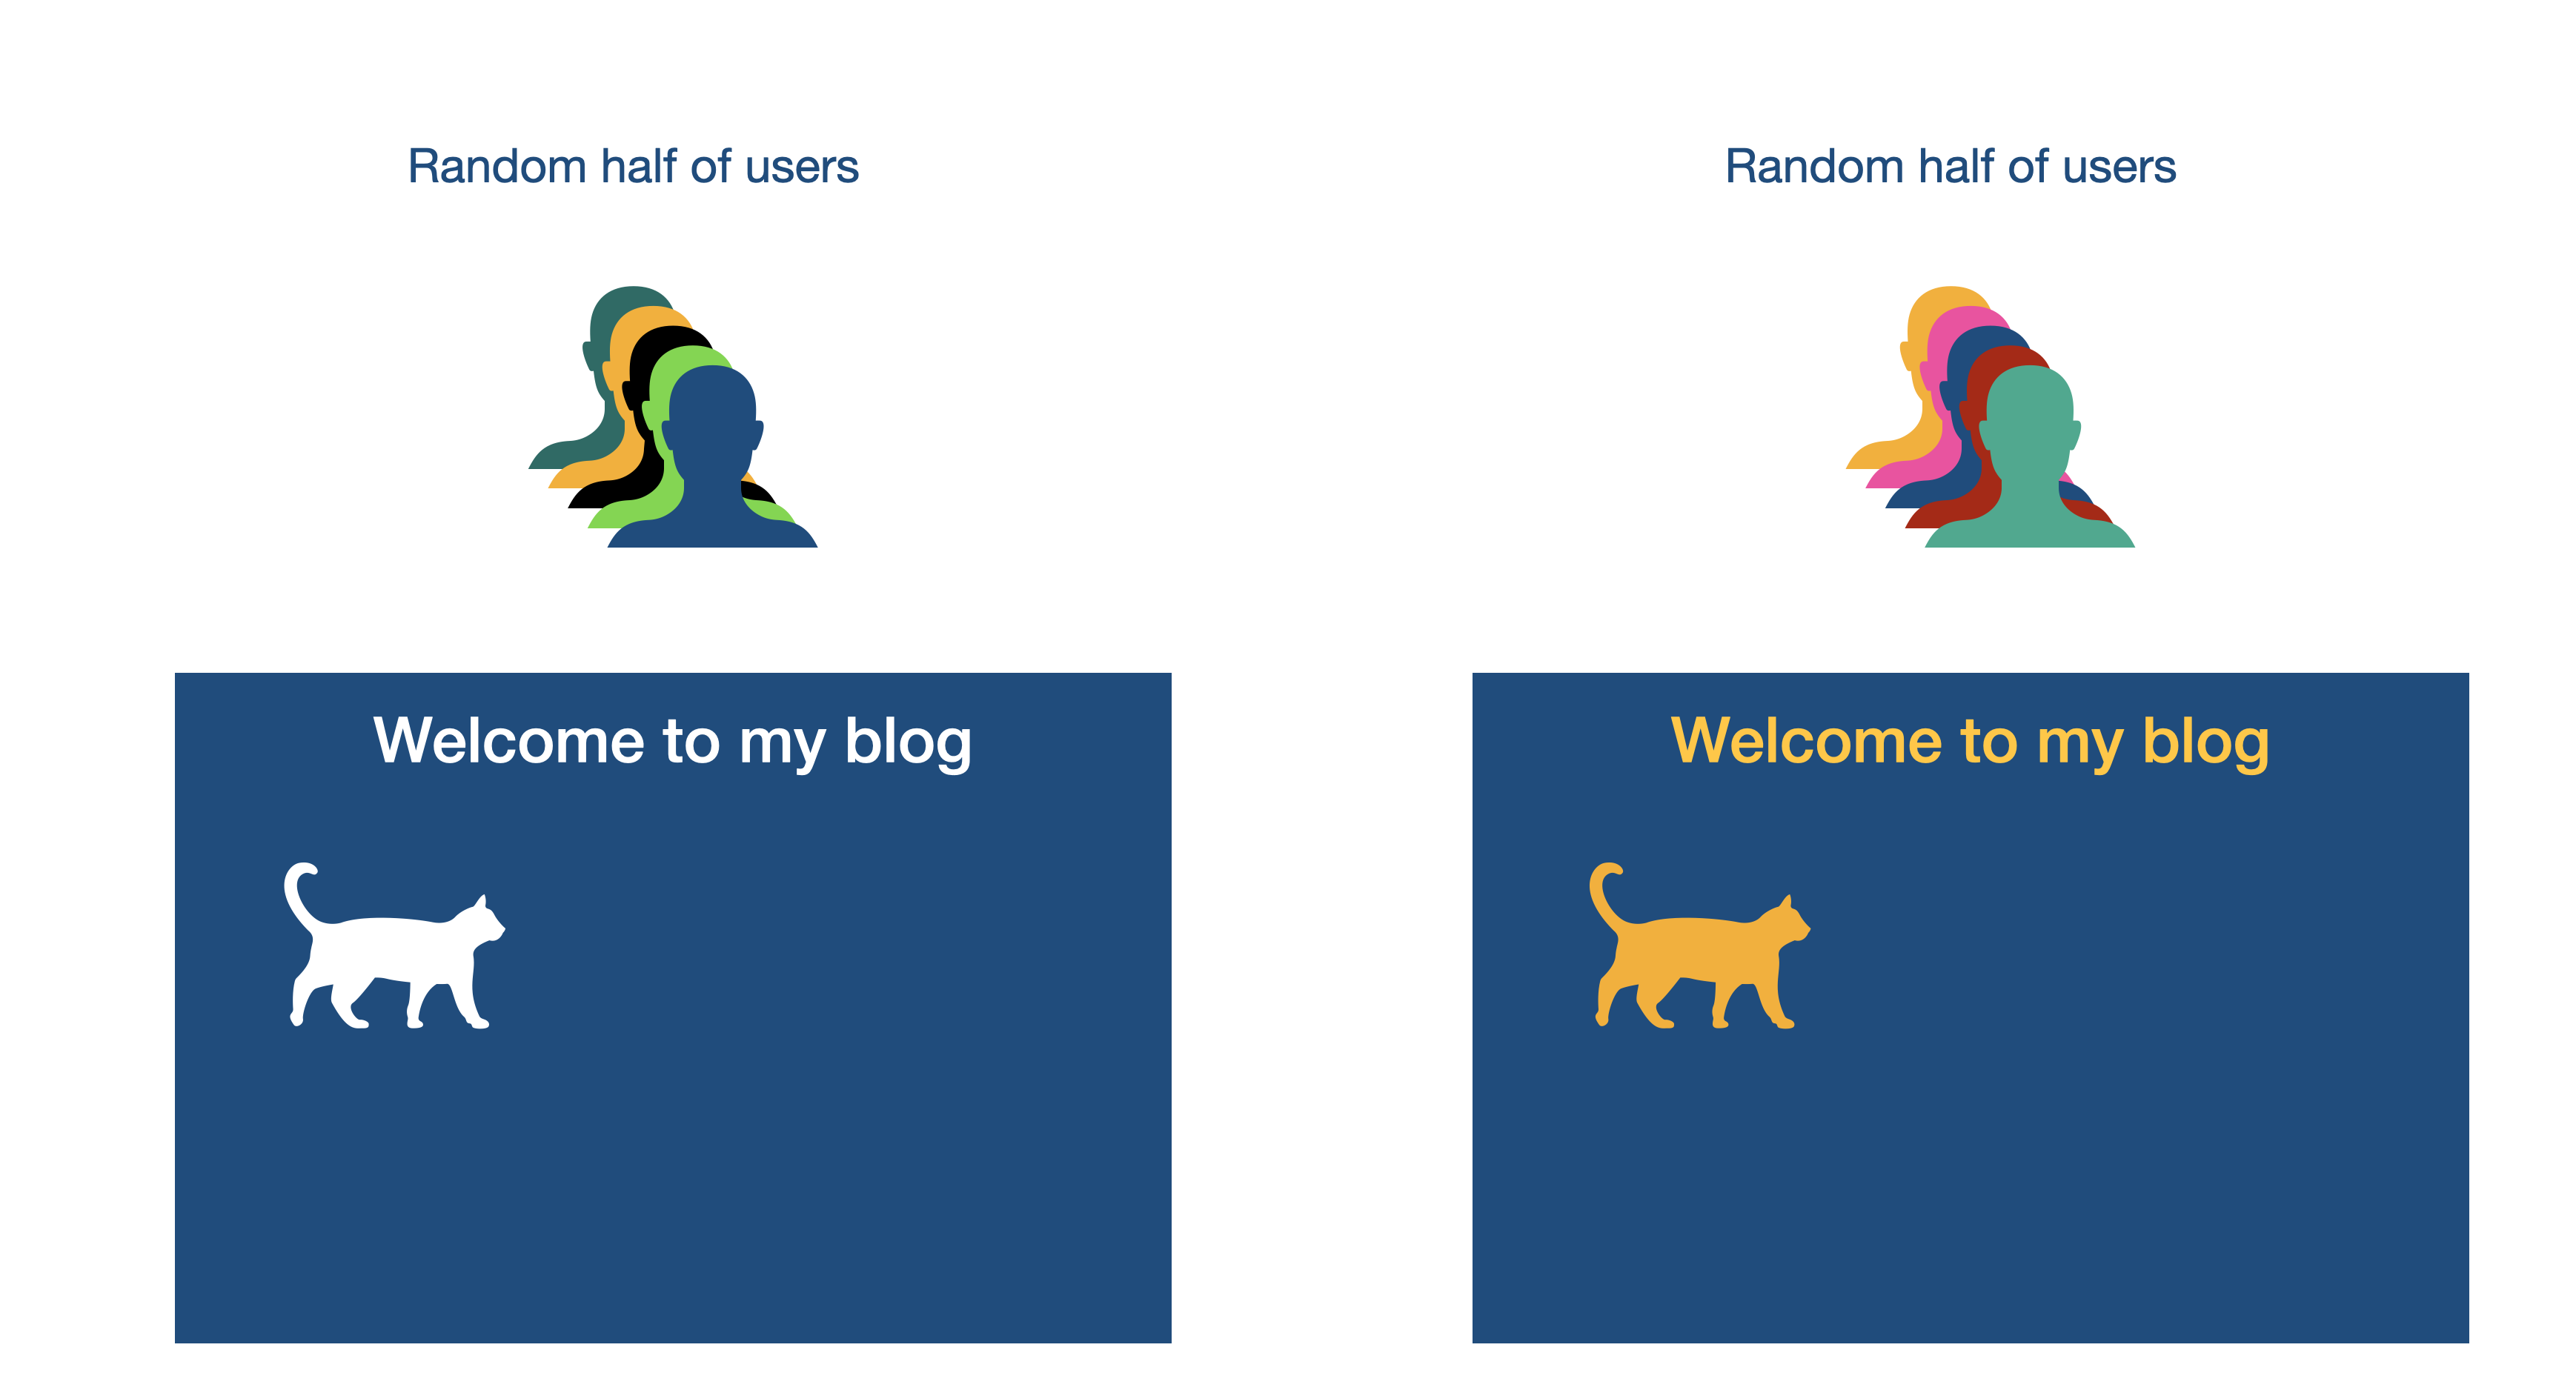
| Versions | A: white text, B: yellow text |
| Response variable (metric) | click-through rate: proportion of users who click on a post |
| Random assignment | each new user is randomly assigned to A or B |
The response variable must be decided before the experiment starts.
| Context | A vs. B | Response variable |
|---|---|---|
| Streaming service | two different thumbnail images for the same show | proportion of users who start watching |
| Online store | free shipping over $35 vs. over $50 | revenue per user |
| two different subject lines | proportion of emails opened | |
| Language-learning app | reminder notification at 9 am vs. 7 pm | proportion of users who return the next day |
| Music app | 1-month vs. 3-month free trial for students | proportion who become paying subscribers |
| Search engine ads | short vs. long ad headline | revenue per search |
The campaign tested its website sign-up page: 4 button labels (e.g., “Sign Up”, “Learn More”, “Join Us Now”) x 6 images or videos
That is 4 × 6 = 24 versions, so technically this is more than an A/B test, but the idea is the same: visitors were randomly assigned to versions.
Source: Tactical Tech, A/B testing: Experiments in campaign messaging
Randomly assign 10 users to version A or B:
In 2012, Facebook changed the News Feeds of 689,003 users for one week: some saw fewer positive posts, others saw fewer negative posts. Researchers then measured whether users’ own posts became more positive or negative.
The results were published in 2014 and caused a big controversy. Users had not been asked for consent.
Discussion
Should companies need users’ consent, or an IRB’s approval, before running A/B tests? Does it matter whether they test a button color or users’ emotions?
A placebo is a fake treatment. If a patient shows an improvement by taking a placebo then this is called a placebo effect.
In blind studies, patients do not know what treatment they receive. In double blind studies neither the patients who receive the treatment nor the doctors who provide it know the type of the treatment.
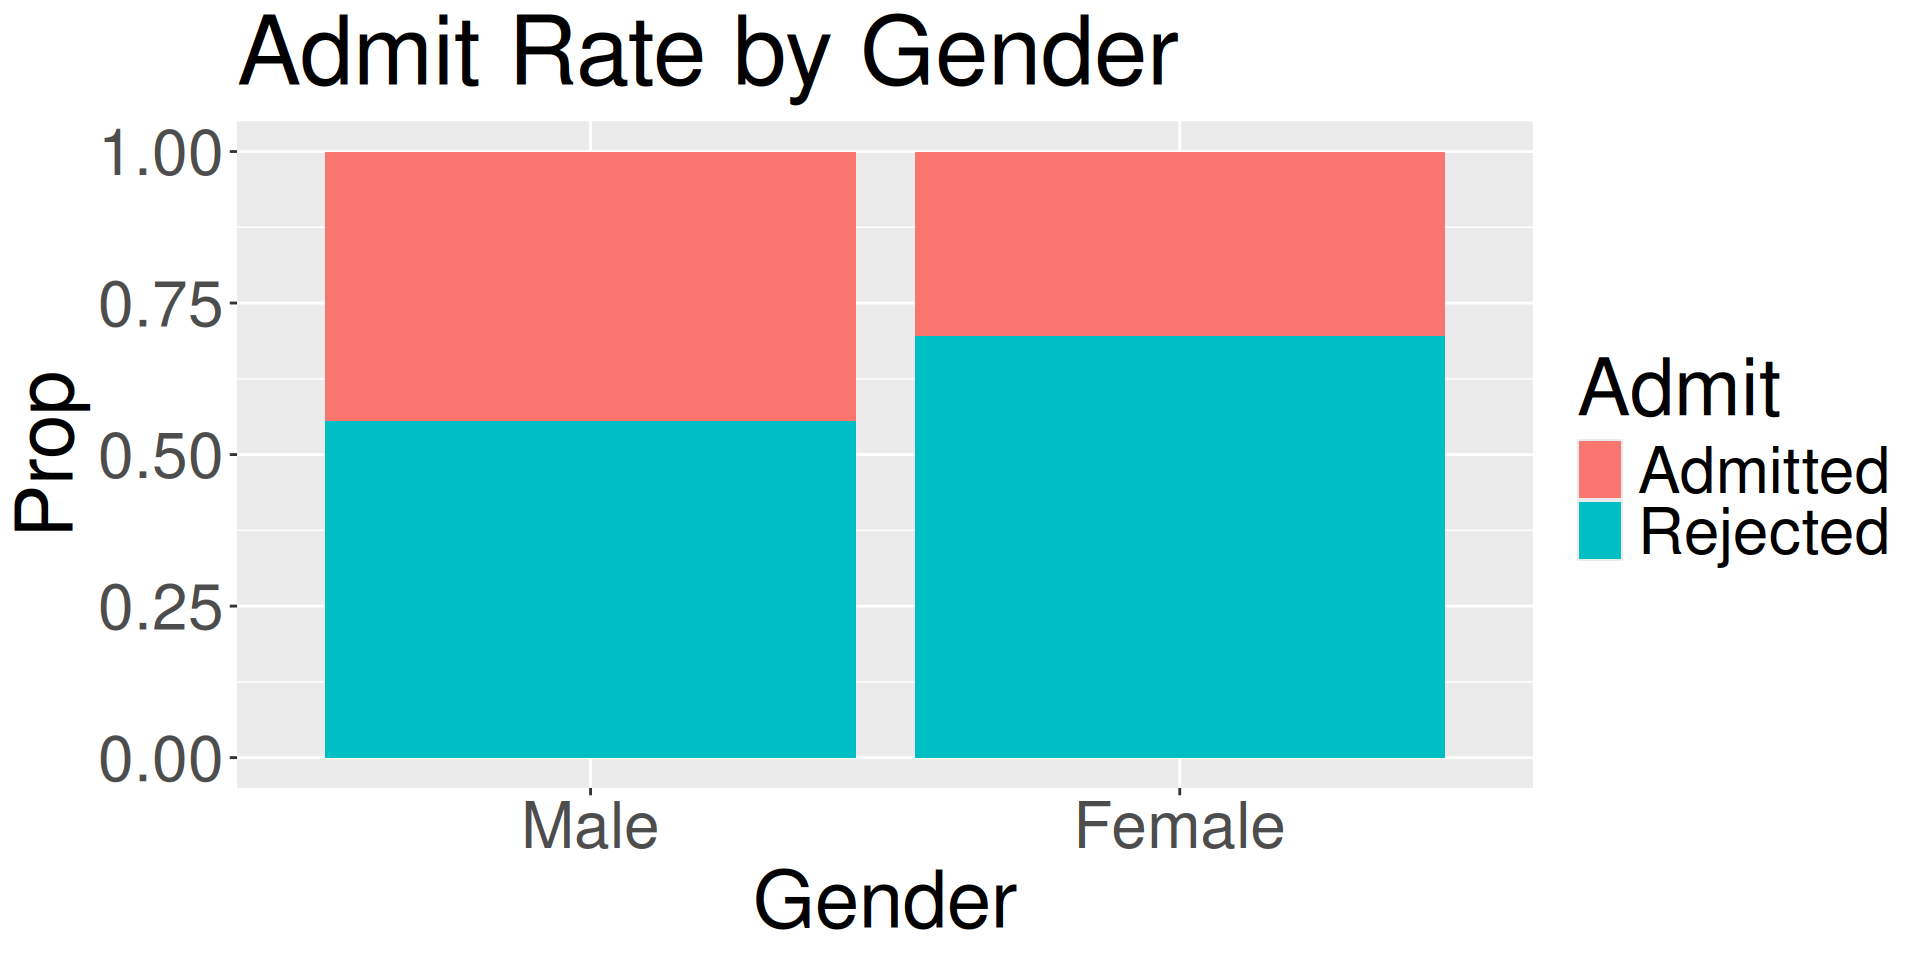
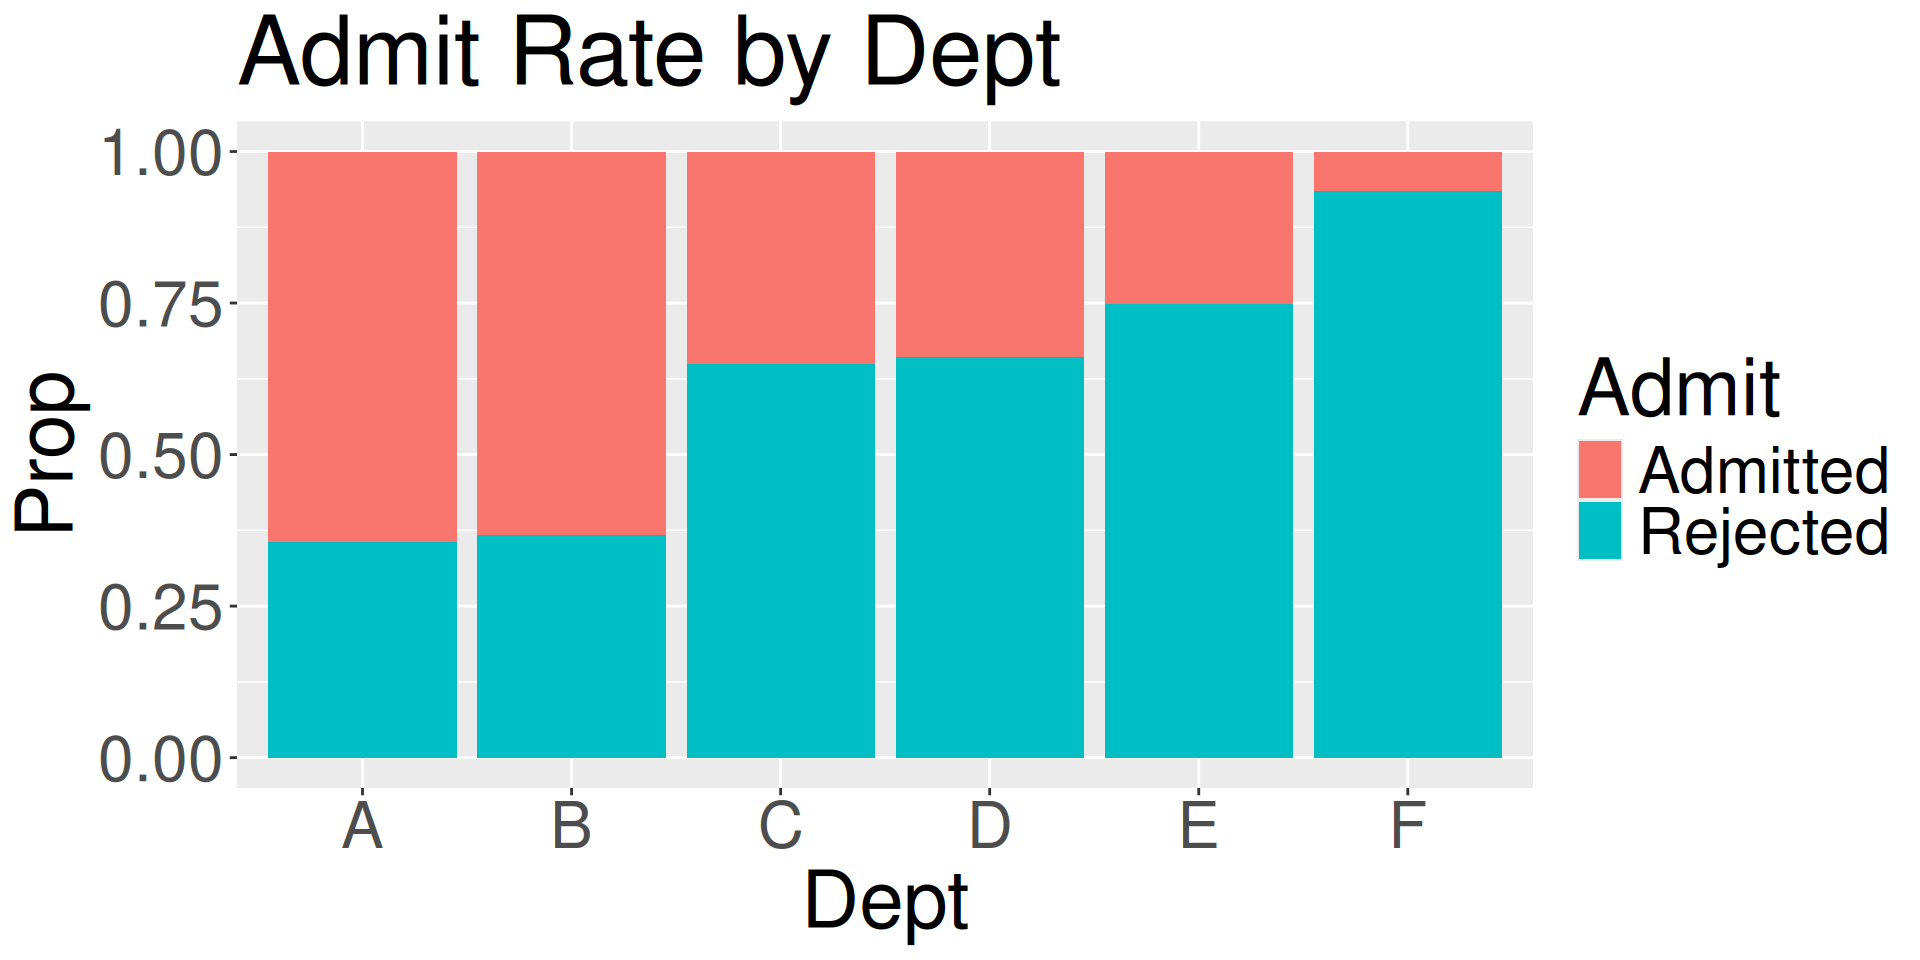
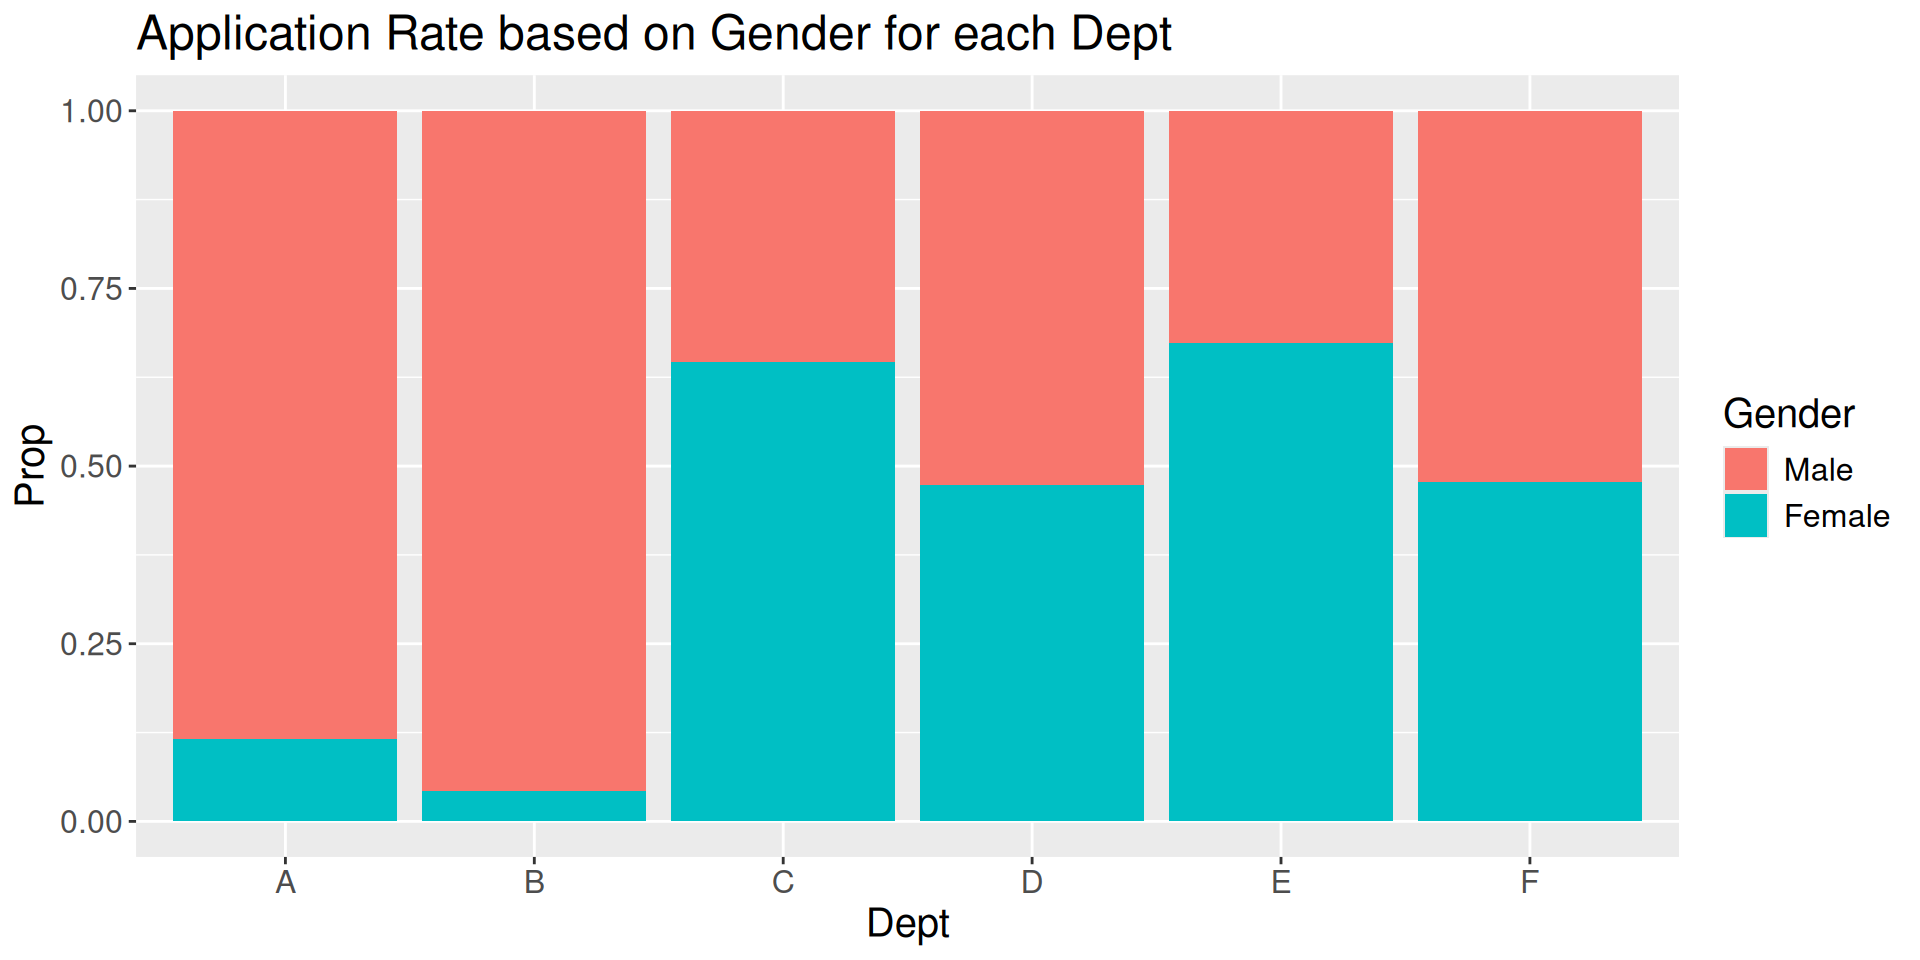
If we observe a certain trend between two variables and this trend disappears or reverses when a third variable is introduced, then this phenomenon is called Simpson’s paradox.
More examples on Wikipedia
We need to move beyond thinking about the relationship between just two variables. We need to keep asking if there are/could be any confounding variables.